
cosmoduende
Saúl Buentello
Recently Published
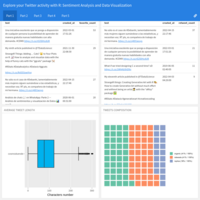
Explore your Twitter activity with R: Sentiment Analysis and Data Visualization
How to analyze your Twitter account (or any account), discover your habits and sentiments with the “rtweet” package and NLP. Medium article: https://medium.com/@cosmoduende/explore-your-twitter-activity-with-r-sentiment-analysis-and-data-visualization-5d16442b517d
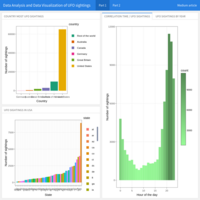
Are we alone in the universe? - Data Analysis and Data Visualization of UFO sightings with R
How to analyze and visualize data of UFO sightings of the last century in the USA and the rest of the world with R language
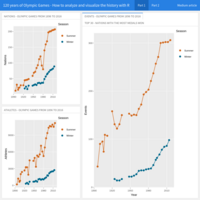
120 years of Olympic Games — How to analyze and visualize the history with R
Find out which countries have won the most medals and how the participation of nations has changed over time, with R. Medium article: https://cosmoduende.medium.com/120-years-of-olympic-games-how-to-analyze-and-visualize-the-history-with-r-3c2a5f3bf875
How to send and receive data and take control of your Arduino, from RStudio
Example: Visualization of Interoperability Data-IoT - How to establish interoperability between R and Arduino (Data and IoT) using a data flow between the two. Medium article: https://towardsdatascience.com/interoperability-data-iot-how-to-send-and-receive-data-and-take-control-of-your-arduino-from-r-eb83005bff87
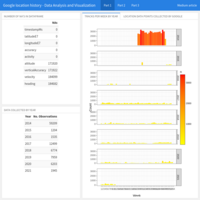
Explore your activity on Google with R: How to Analyze and Visualize your Location History
Find out how and how much you have allowed Google to track you, using a copy of your personal data from Google Takeout (your location history). Medium article: https://medium.com/geekculture/explore-your-activity-on-google-with-r-how-to-analyze-and-visualize-your-location-history-2ea8edabe733
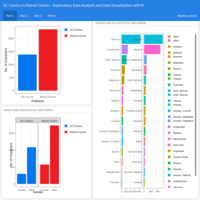
DC Comics vs Marvel Comics — Exploratory Data Analysis and Data Visualization with R
Who has the smartest, strongest, fastest, or most powerful hero or villain? How to answer this and more questions with R. Medium article: https://cosmoduende.medium.com/dc-comics-vs-marvel-comics-exploratory-data-analysis-and-data-visualization-with-r-da557892c2f6
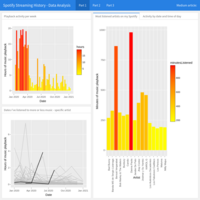
Explore your activity on Spotify with R and “spotifyr”: How to analyze and visualize your streaming history and music tastes
Find out how and how much you consume from Spotify, using a copy of your personal data and the “spotifyr” package. Medium article: https://cosmoduende.medium.com/explore-your-activity-on-spotify-with-r-and-spotifyr-how-to-analyze-and-visualize-your-stream-dee41cb63526
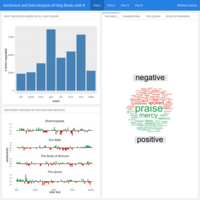
What’s the most positive or negative religion? — Sentiment and Data Analysis of Holy Books with R
Analysis of religious dogmas by exploring their Holy Books (The Bible, The Quran, The Dhammapada, and The Book of Mormon) with R
Medium article: https://cosmoduende.medium.com/whats-the-most-positive-or-negative-religion-sentiment-and-data-analysis-of-holy-books-with-r-3fb881289f51
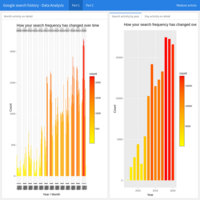
Explore your activity on Google with R: How to Analyze and Visualize Your Search History
Find out how and how much you have used the most popular search engine in the world, using a copy of your personal data. Medium article: https://cosmoduende.medium.com/explore-your-activity-on-google-with-r-how-to-analyze-and-visualize-your-search-history-1fb74e5fb2b6
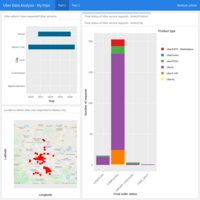
Explore your activity on Uber with R: How to analyze and visualize your personal data history
Explore your activity on Uber with R: How to analyze and visualize your personal data history. Find out how you consume the Uber App using a copy of your data. Medium article: https://medium.com/@cosmoduende/explore-your-activity-on-uber-with-r-how-to-analyze-and-visualize-your-personal-data-history-f3f04fc9338c
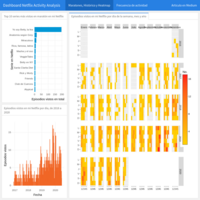
Explora tu actividad en Netflix con R: Análisis y visualización de datos de tu historial
Análisis y visualización de datos con R de historial de actividad en Netflix de tu cuenta personal. Visualización de maratones de series más vistas y frecuencia de actividad por días, meses y años. Artículo en Medium: https://medium.com/@cosmoduende/explora-tu-actividad-en-netflix-con-r-an%C3%A1lisis-y-visualizaci%C3%B3n-de-datos-de-tu-historial-5aa44ab9ec17
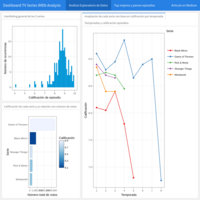
Análisis y visualización de Datos de TV Series. Datos extraídos de IMDb con R
Análisis y visualización de Datos con R de algunas de las tv series más populares (especialmente entre la cultura geek): Black Mirror, Westworld, Game of Thrones, Rick and Morty y Stranger Things. Datos extraídos de IMDb por Web Scraping. Artículo en: https://medium.com/@cosmoduende/tv-series-que-geeks-y-no-tan-geeks-amamos-an%C3%A1lisis-de-datos-extra%C3%ADdos-de-imdb-con-r-ae0d175da064
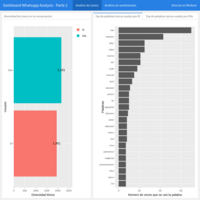
Análisis de chats en WhatAapp: Parte 2 - Análisis de sentimientos y visualización de Datos con R
Conoce el poder que brinda R para realizar análisis de sentimientos de conversaciones enteras de WhatsApp, como los ejemplos de plots mostrados en este dashboard. Artículo en: https://medium.com/@cosmoduende/an%C3%A1lisis-de-chats-en-whatsapp-parte-2-an%C3%A1lisis-de-sentimientos-y-visualizaci%C3%B3n-de-datos-con-r-8f7dc0a10185
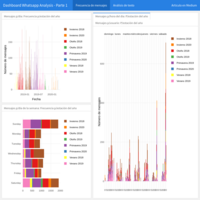
Análisis de chats en WhatAapp: Parte 1 - Análisis de texto y visualización de Datos con R
Conoce el poder que brinda R para realizar análisis de conversaciones enteras de WhatsApp, como los ejemplos de plots mostrados en este dashboard. Artículo en: https://medium.com/@cosmoduende/an%C3%A1lisis-de-chats-en-whataapp-parte-1-an%C3%A1lisis-de-texto-y-visualizaci%C3%B3n-de-datos-con-r-6d254c39029d
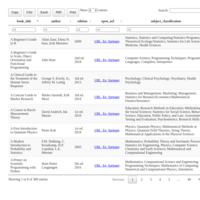
Tabla de consulta de libros en Springer
Tabla para consulta de libros de Springer por título, año, autor, etc. También exporta la tabla como pdf, excel, o csv.
Publicación en medium: https://medium.com/@cosmoduende/descarga-en-pdf-cientos-de-libros-de-springer-con-r-edfb8649bf0d
Github: https://github.com/cosmoduende/descarga-pdf-springer