
czqiu
czqiu
Recently Published


EDA2
different ways to look data

EDA1
different ways to do data EDA


MMRM from lme4 contrast
how to get contrast difference from lme4 because fit_mmrm() has default interaction.

dataexplore
extra data explore with dataxray package


Line plot with table
Line plot with table under xaxis
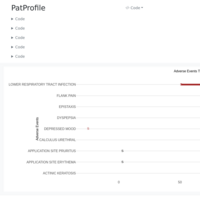
AE plot with auto batch loop for each subject ID
AE plot with auto batch loop for each subject ID

CDC line plot
CDC line plot with dynamic position of label for each line
watermark
different adjustment of watermarks on ggplotly
ANCOVA from tern R package
how to quickly do ANCOVA for a set of variables quickly (loop) with tern R package
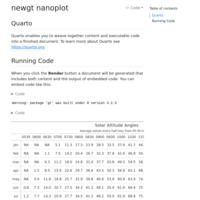
Nanoplot
gt nanoplot for investigation
interactive table
interactive table can show detailed dataset or plot for frequency

Quarto presentation test
Quarto presentation test
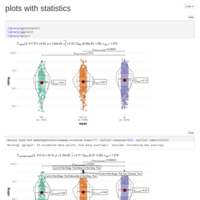
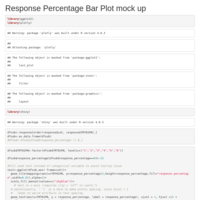
plots with statistics
plots with statistics
one sample proportion power calculation
different ways to calculate power for one sample proportion test
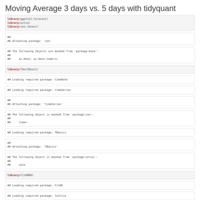
MA3MA5 stock analysis
MA3MA5 stock analysis
interactive KM plot
produce interactive KM plot
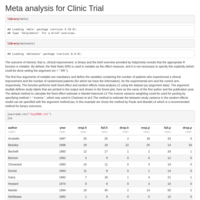
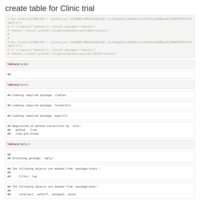
Meta analysis for Clinic Study
simple meta analysis with R in Clinic study
LB value status tracing
to see if LB value from subject changes status or not along timeline
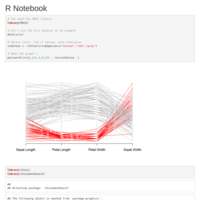
SpagehttienhancedPlot
show on treatment, off treatment, treatment restarted along time points
CART with VisNetwork
decision tree with VisNetwork package
r2d3 simple example
utilize D3.js in R by using r2d3 package

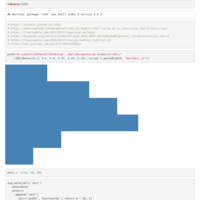
Advanced dynamic heatmap
dynamic heatmap with more customized features by using highcharter
Dynamic single color Bar plot
it is tricky to create dynamic single color bar plot with geom_tile
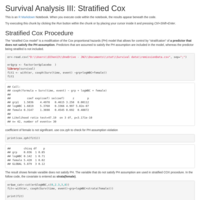
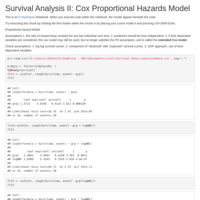
Survival Analysis III
stratified cox proportional hazards model what is stratification. what is the assumption for stratified variable. Is interaction needed in model
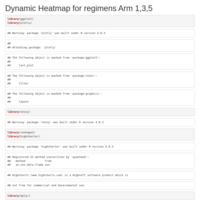
dynamic bar chart
very tricky. geom_bar does not work well with subgroup. geom_tile is used to trick the plot

Dynamic change of heat map
Dynamic change of heat map
TLF with contents
extra content table added
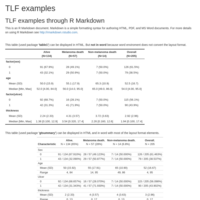
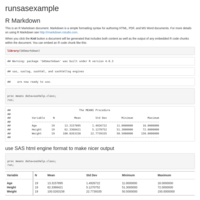
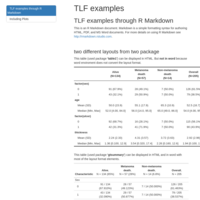
TFL examples
Table, Figure list examples for clinic study
ARIMAGarch forcast AAPL
https://www.quantstart.com/articles/ARIMA-GARCH-Trading-Strategy-on-the-SP500-Stock-Market-Index-Using-R/
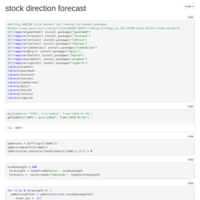
ARMAGarch forcast stock direction
https://www.quantstart.com/articles/ARIMA-GARCH-Trading-Strategy-on-the-SP500-Stock-Market-Index-Using-R/


Find Peak Valley on curve
Find Peak Valley on curve


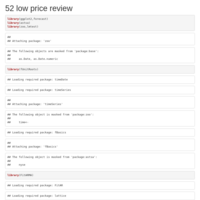
52week low
check 52 week low/high for each stock (252 business days)
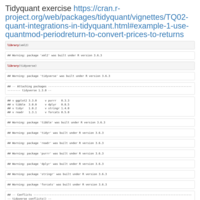
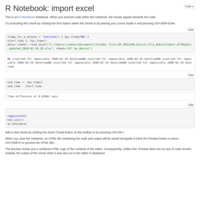
test import excel
test import excel
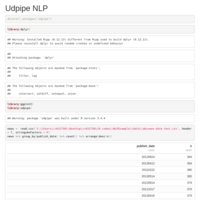
NLP example
newspaper NLP
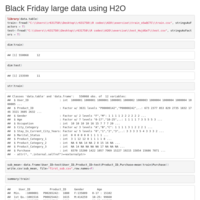
Black Friday Prediction large data using H2O
https://datahack.analyticsvidhya.com/contest/black-friday-data-hack/
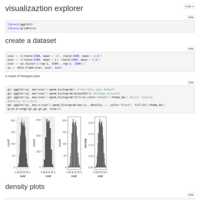
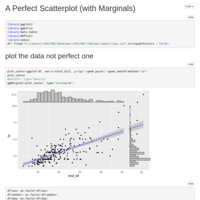
A better scatterplot with marginals
A better scatterplot with marginals
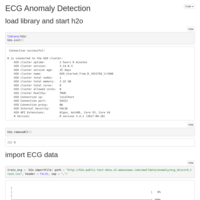
ECG Anomaly Detection
using deep autoencoder learning model
h2o glm prediction model small exercises
a lot of small dataset and exercises for h2o glm model
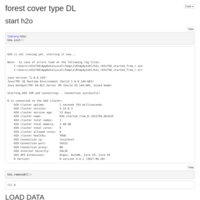
Predicting forest cover type from cartographic variables only
Predicting forest cover type from cartographic variables only (no remotely sensed data).
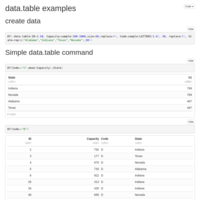
data.table examples
data.table package examples
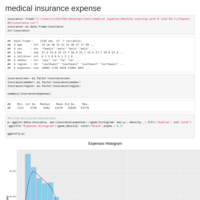
medical expense linear regression prediction
medical expense cost prediction example exercise from book Machine Learning in R