
danielkirsch
Daniel Kirsch
Recently Published
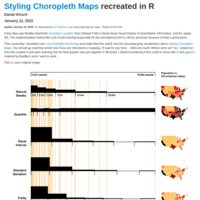
Styling Choropleth Maps recreated in R
A few days ago Bradley Boehmke recreated a graphic from Edward Tufte’s classic book Visual Display of Quantitative Information, 2nd Ed. (page 30). Then yesterday I stumbled over Lisa Charlotte Rost’s blog and really liked the article and the accompanying visualization about Styling Choropleth Maps. I asked her how she created it and upon learning that the final graphic was put together in Illustrator I started wondering if this could be done with R and ggplot2. Inspired by Bradley’s post I went to work.