Recently Published
Time to stop the exploitation of free academic labour
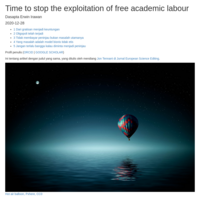
Time to stop the exploitation of free academic labour
Ini tentang artikel dengan judul yang sama, yang ditulis oleh mendiang [Jon Tennant di Jurnal European Science Editing](https://ese.arphahub.com/article/51839/).
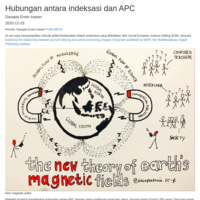
Hubungan antara APC dengan indeksasi jurnal (jurnal terbitan MDPI)
Makalah tersebut menjelaskan hubungan antara APC dengan status indeksasi jurnal dan status Journal Impact Factor (JIF) serta CiteScore jurnal-jurnal terbitan MDPI.
Hasil utamanya adalah:
>The charges levied by journals that had both IF and CiteScore were significantly higher than those charged by journals with neither IF nor CiteScore (p <0.05). The charges were also correlated to the age of the journal: the more recently launched journals charged less than the older journals did.
Lima (ternyata enam) kultur akademik yang terlupakan
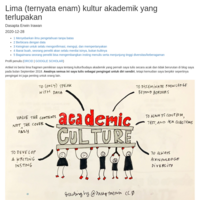
Lima (ternyata enam) kultur akademik yang terlupakan
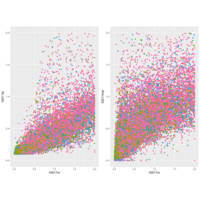
Plot Cite Score 2017 vs SNIP 2017 and SJR 2017
The following plot shows the correlation between Cite Score 2017 vs SNIP 2017 and SJR 2017
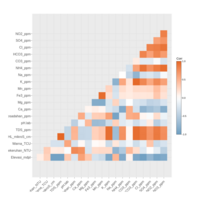
correlation matrix in HTML
This plot were produced using plotly package
My trials on Google Scholar R package
Background
This is the good thing about open database. Although Google Scholar (GS) is not a completely open database, but people at Google let us to do the following things using R and Scholar. The following post was my first trial to the scholar package to harvest GS data.
Getting your GS ID
Your GS ID will be written in the url of your profile, for instance:
Erwin: url https://scholar.google.co.id/citations?user=Myvc78MAAAAJ&hl=en&authuser=1; GS ID “Myvc78MAAAAJ&hl”"
Prof. Edy Soewono: url https://scholar.google.co.id/citations?user=6U_YtvMAAAAJ&hl=en&authuser=1; GS ID “6U_YtvMAAAAJ&hl”
Prof. Khairurrijal: url https://scholar.google.co.id/citations?user=4_asJ0MAAAAJ&hl=en&authuser=1; GS ID “4_asJ0MAAAAJ&hl”
Dr. Jon Tennant: url https://scholar.google.co.id/citations?user=P7FvGMEAAAAJ&hl=en; GS ID “P7FvGMEAAAAJ&hl”
Introduction to R for computational chemistry student ITB
The following slides are made for a short talk on introduction to R for chemistry student (Institut Teknologi Bandung)
Wed, 13 April 2015, Room 9305, Labtek V, ITB
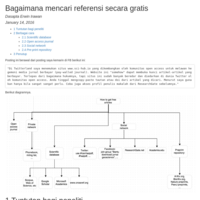
Bagaimana mencari artikel secara gratis
Artikel pendek ini menceritakan bagaimana mengatasi masalah pengunduhan makalah-makalah dari jurnal berbayar secara legal. Muncul pertama kali sebagai blogpost di http://dasaptaerwin.net/wp.
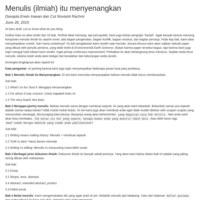
Outline Buku: Menulis (ilmiah) itu menyenangkan
Ini adalah file berisi outline proyek buku kami berikutnya. Menulis (ilmiah) itu menyenangkan. Proyek ini saya kerjakan bersama istri saya (Cut Novianti). Baru draft, jadi silahkan memberikan komentar. Terimakasih atas perhatian dan apresiasinya.
Introduction to R: R in the library
The following slides are the materials presented in the 3rd Workshop Introduction to R: R in the library, ITB Central Library, 26 May 2015, 13.00-15.00.
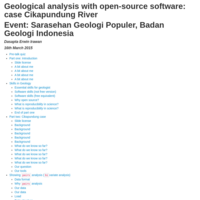
Hydrogeological analysis using open source app: case Cikapundung River, Bandung, West Java, Indonesia
My talk on Sarasehan Geologi Populer, 16th March 2015, at Badan Geologi. This talk covers various open source tools for geological and hydrogeological analysis with focus on Cikapundung river case. Some examples of R code to extract hidden pattern in the data set, in order to explain natural phenomenon.
Geological analysis with open-source software: case Cikapundung River (part 1)
This is the first draft for my upcoming talk in Sarasehan Geologi Populer, Badan Geologi, 13th March 2015.
"Finding" Indonesia?
This blogpost was my perspective on how important it is to include the word "Indonesia" in every part of a (scientific) document to increase its online (scientific) visibility.
Lec1_1_ExplorationHydrogeology
This is part of my lecture on Exploration Hydrogeology, given for master students of Groundwater Engineering, Institut Teknologi Bandung, Indonesia.
January 2015
IntroR: 1. Introduction to R
This is the first R course in Institut Teknologi Bandung, and perhaps in Indonesia. This course covers the introductory part of R. Pls download R base from http://cran.r-project.org and R Studio from http://rstudio.com prior to entering the class. The materials will be available on https://github.com/dasaptaerwin/IntroR using R Markdown format (Rmd) and pdfs. As I am also prone to errors, please report as soon as you find them.
For more engagement, I will be on:
email: dasaptaerwin@outlook.co.id
twitter: @dasaptaerwin
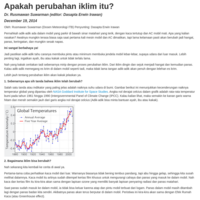
AnakBertanya-Iklim
A blogpost on what is climate change. Posted at anakbertanya.com, written on R Markdown.
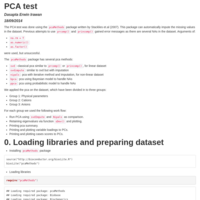
PCA on water quality dataset
The following example is a PCA on water quality dataset.
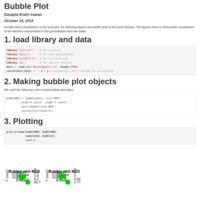
Example of bubblePlot on water quality dataset
Example of bubblePlot on water quality dataset
This is an example of visualization of bubble plot on water quality dataset.
The objective of this plot is to show comparison of element concentration in groundwater and in the river water. The river data plot is located in the lower right position of the figure, making an elbow-like shape.
However, I haven't finished tweaking the code so it can show the figure in the correct size.
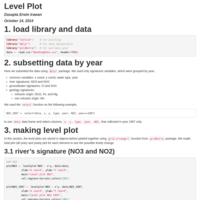
Example of levelPlot on water quality dataset
Example of levelPlot on water quality dataset
This is an example of visualization of level plot on water quality dataset.
The objective of this plot is to show comparison of element concentration in groundwater and in the river water. The river data plot is located in the lower right position of the figure, making an elbow-like shape.
However, I haven't finished tweaking the code so it can show the figure in the correct size.
0926-RandomForestSlide
This was my learning process while trying out the randomForest package
PA2_template: Coursera Peer Assignment 2
This work is made based on my knowledge in R and several references listed in the document.
dplyr tutorial (Indonesian)
Post ini adalah update dari versi sebelumnya di http://rpubs.com/dasaptaerwin/27419
This post is an update from the previous posted as http://rpubs.com/dasaptaerwin/27419.
dplyr package exercise: in Indonesia language
This tutorial replicates Kevin Markham tutorial (http://rpubs.com/justmarkham/dplyr-tutorial) in Indonesia language.
One more thing about data science
a short essay on how important data is
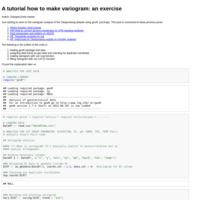
[updated] A tutorial how to make variogram: an exercise
Updated from my previous post.
I changed the boundary of "expandgrid" function in the fitting section.
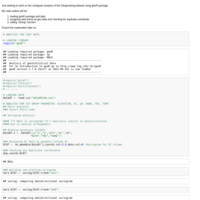
Variogram
Example of variogram codes. I'll add the explanation later
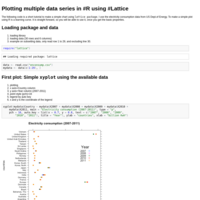
Plotting multiple data series in #R using #Lattice
a simple plotting example using lattice package and World's electricity consumption from US Dept of Energy.
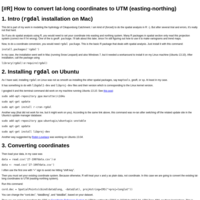
[#R] How to convert lat-long coordinates to UTM (easting-northing)
a simple codes to convert lat-long coordinates to UTM system. I also add a workaround using GIS app (QGIS and GRASS). Thanks to Dmitry Kolesov from GRASS GIS Facebook Community.
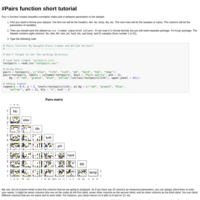
#Pairs function short tutorial
This is a short tutorial in using "pairs" function in R to make correlation matrix.
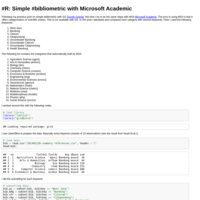
Simple #bibliometric with Microsoft Academic
Preliminary #bibliometric analysis on several keywords with Microsoft Academic
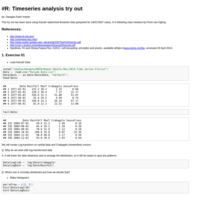
#R: Timeseries analysis try out
Try out of timeseries analysis using "Forecsat" package by Rob J. Hyndman.
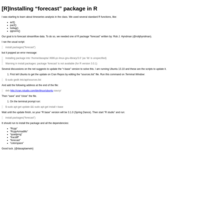
[R]Installing “forecast” package in R
It is confusing to experience that R studio is behaving differently in different kinds of platforms. It is my personal experience. One of the problem occurs in installing R package. In this case "Forecast" by Rob J. Hyndman. Oftenly install is due to old version of R-base. So we need to upgrade it, and this is how.
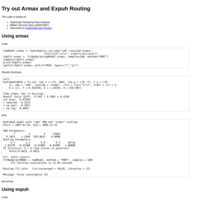
Try out Armax and Expuh Routing
try out armax and expuh routing to see the best fit using Cikapundung dataset (2007-2010)
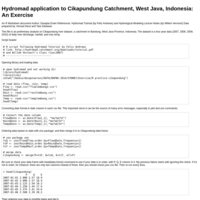
Hydromad application to Cikapundung Catchment, West Java, Indonesia: An Exercise
an exercise of Hydromad package using Cikapundung catchment (West Java, Indonesia) dataset.
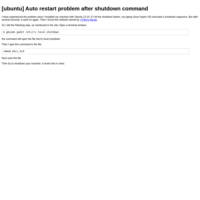
[Ubuntu] Auto restart problem after shutdown command
A way to solve auto restart after shutdown command.
I use Ubuntu 13.10.
This steps were previously suggested in http://goo.gl/RyKCiM
