
davehawkins
David Hawkins
Recently Published

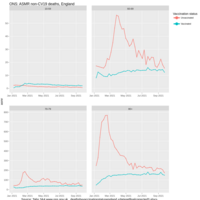
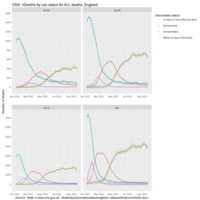
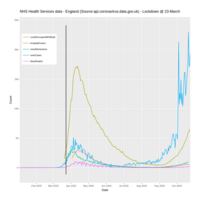
ONS TABLE 8 data England: deaths occurring between 1 January 2021 and 31 January 2022
ONS all cause deaths published 16-March-2022 at
https://www.ons.gov.uk/file?uri=%2fpeoplepopulationandcommunity%2fbirthsdeathsandmarriages%2fdeaths%2fdatasets%2fdeathsbyvaccinationstatusengland%2fdeathsoccurringbetween1january2021and31january2022/referencetable20220316accessible.xlsx
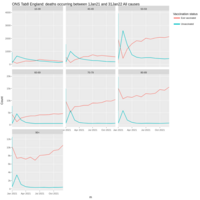
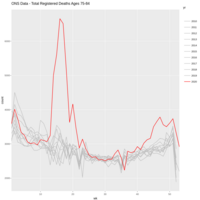
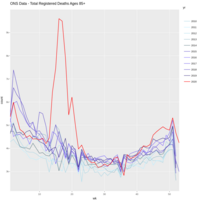
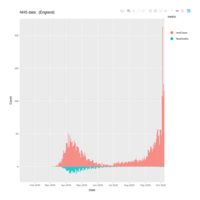
ONS data England: deaths occurring between 1 January 2021 and 31 January 2022
Published by ONS on 16-March-2022
https://www.ons.gov.uk/file?uri=%2fpeoplepopulationandcommunity%2fbirthsdeathsandmarriages%2fdeaths%2fdatasets%2fdeathsbyvaccinationstatusengland%2fdeathsoccurringbetween1january2021and31january2022/referencetable20220316accessible.xlsx
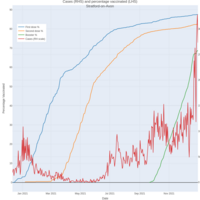
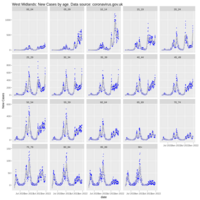

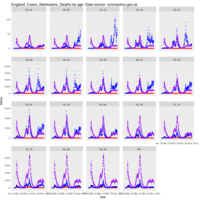
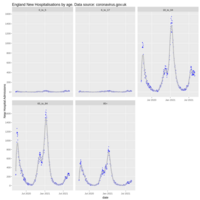
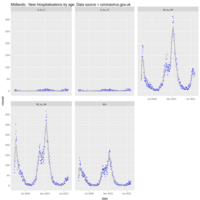
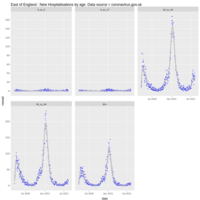
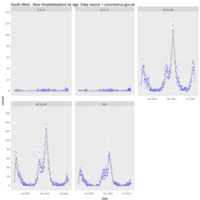
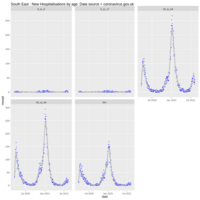
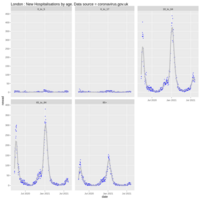
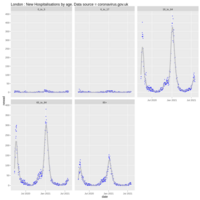
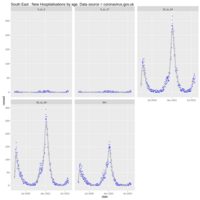
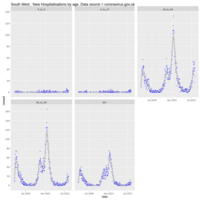
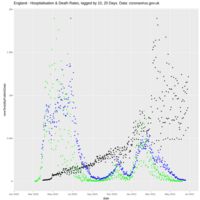
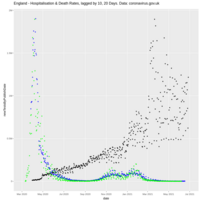
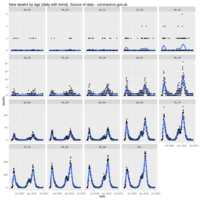
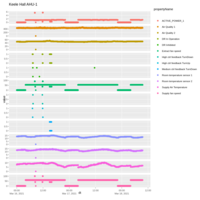
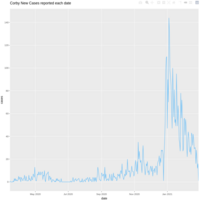
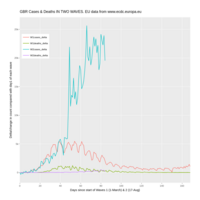
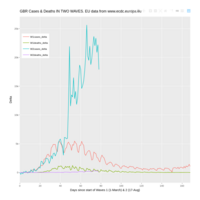
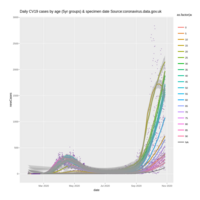
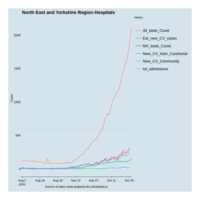
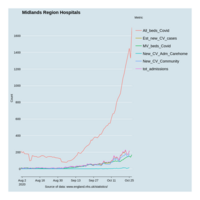
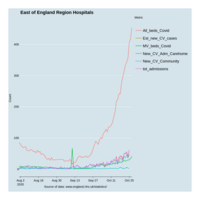
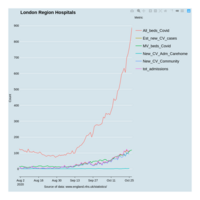
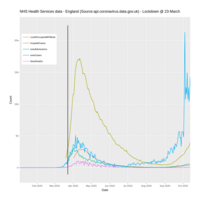
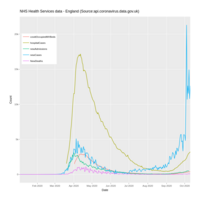
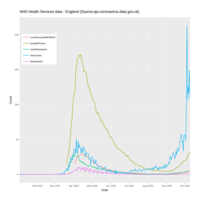
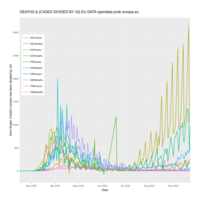
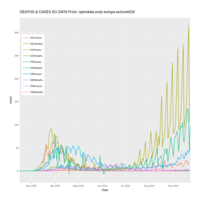
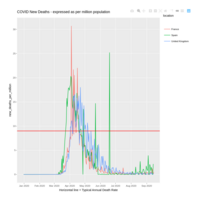
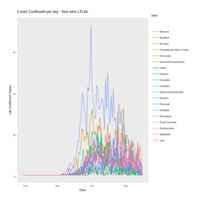
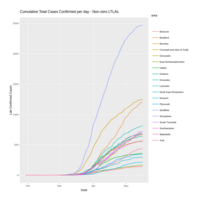
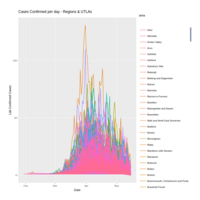
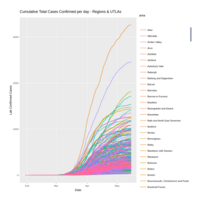
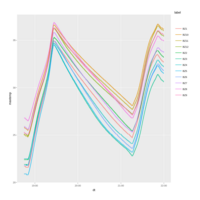
Cases, Admissions & Deaths
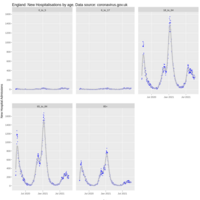
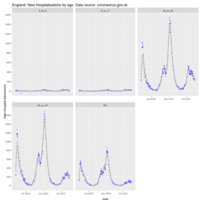
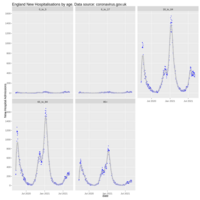
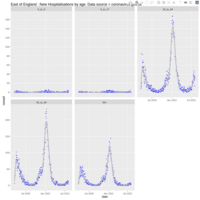
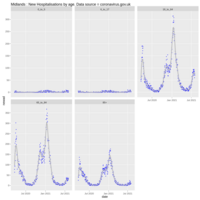
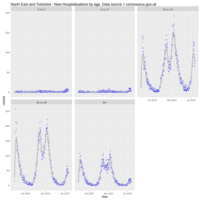
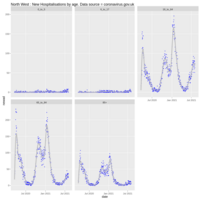
Admissions are not age-related (curve is the same on each graph)
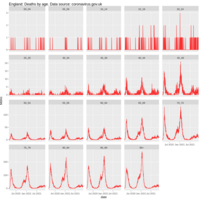
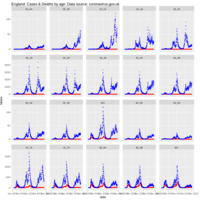
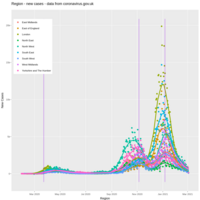
Gov data
Cases & deaths by age
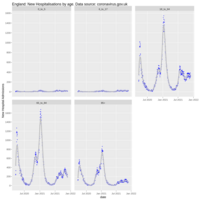
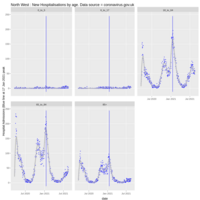
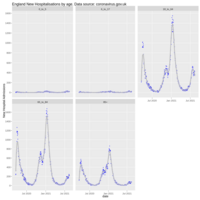
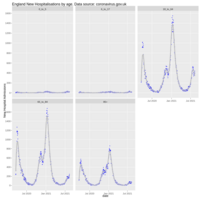
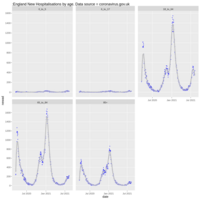
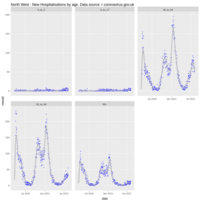
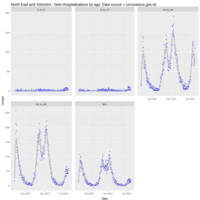
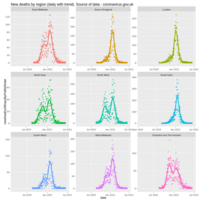
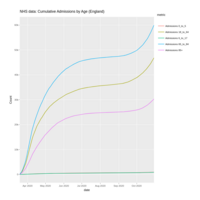
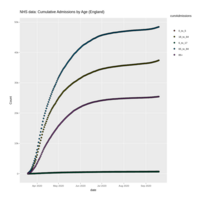
England - Hospitalisations by age
From
https://api.coronavirus.data.gov.uk/v2/data?areaType=nhsRegion&metric=cumAdmissionsByAge&format=csv
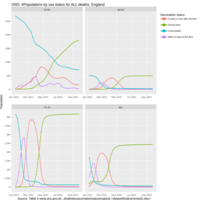
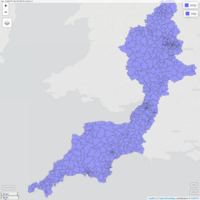
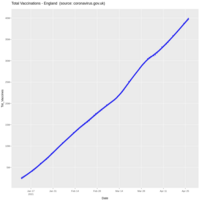
ONS Vaccination Populations
Table 4
https://www.ons.gov.uk/peoplepopulationandcommunity/birthsdeathsandmarriages/deaths/datasets/deathsbyvaccinationstatusengland
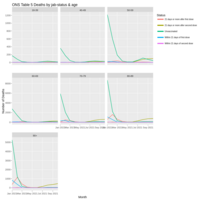
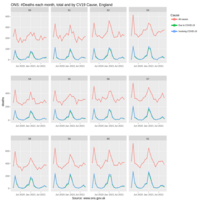
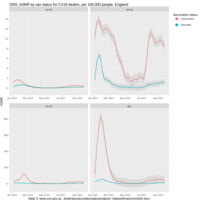
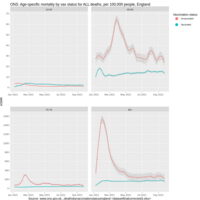
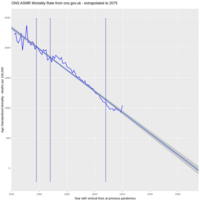
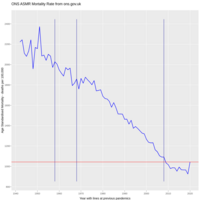
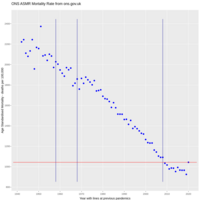
ONS ASMR by each Vaccine status, by age
Table 4
https://www.ons.gov.uk/peoplepopulationandcommunity/birthsdeathsandmarriages/deaths/datasets/deathsbyvaccinationstatusengland
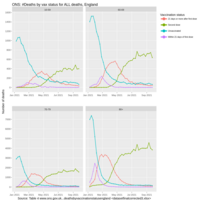
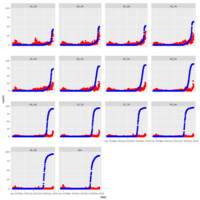
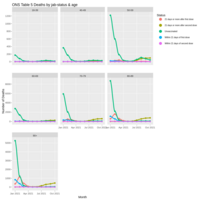
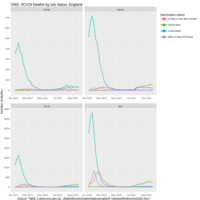
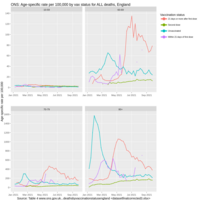
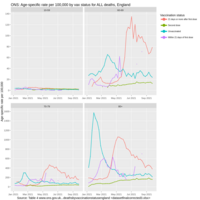
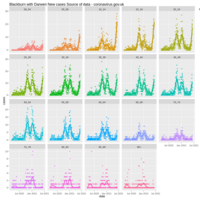
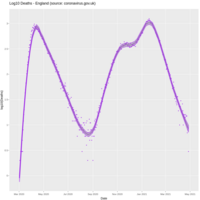
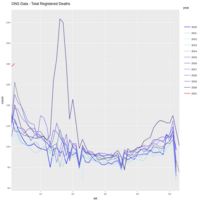
ONS Deaths by vaccination status
Table 4
https://www.ons.gov.uk/peoplepopulationandcommunity/birthsdeathsandmarriages/deaths/datasets/deathsbyvaccinationstatusengland
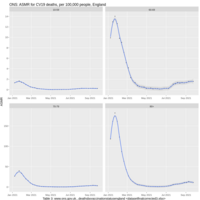
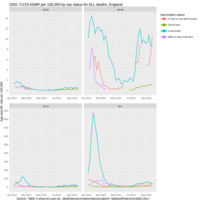
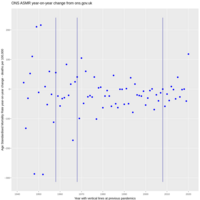
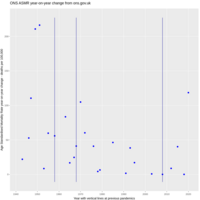
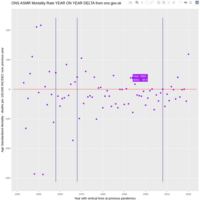
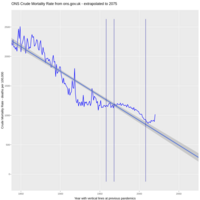
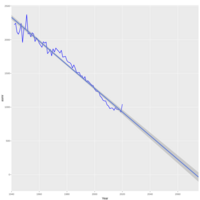
ONS ASMR
Table 4 data - https://www.ons.gov.uk/peoplepopulationandcommunity/birthsdeathsandmarriages/deaths/datasets/deathsbyvaccinationstatusengland
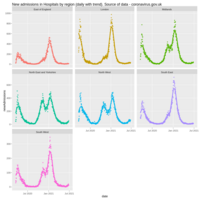
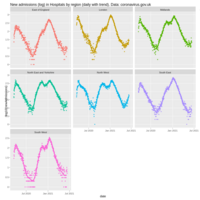
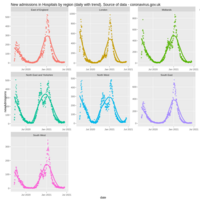
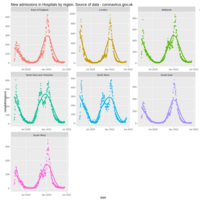
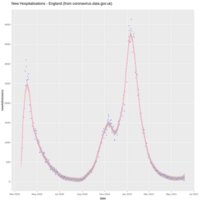
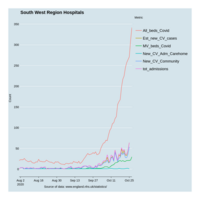
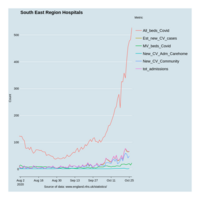
New admissions - Hospitals
from gov.uk
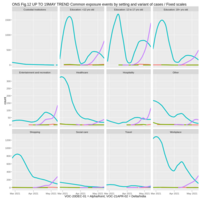
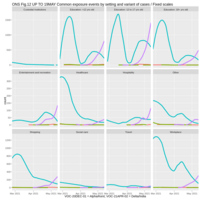
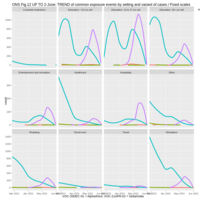
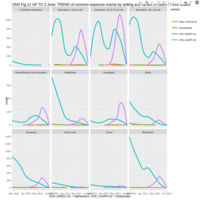
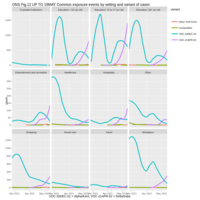
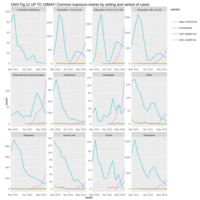
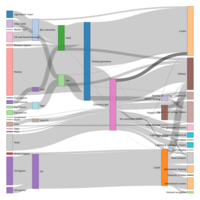
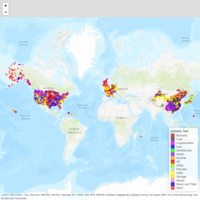
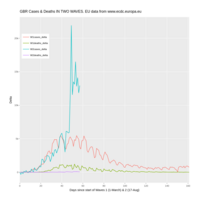
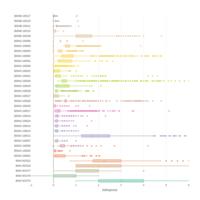
ONS Variant Fig 12 to 19-May
"Weekly number of common exposure events among sequenced cases, by setting and variant of cases (bars), and proportion of weekly common exposure events among sequenced cases associated with Delta"
Limited to data before 20-May-2021
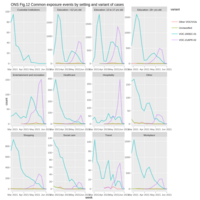
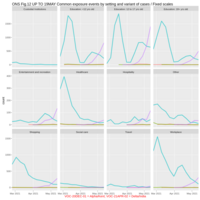
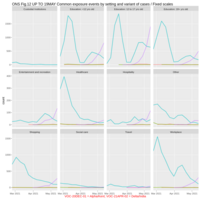
ONS Fig.12
"Figure 12. Weekly number of common exposure events among sequenced cases, by setting and variant of cases (bars), and proportion of weekly common exposure events among sequenced cases associated with Delta"
I haven't (yet) added a geom_smooth for Delta
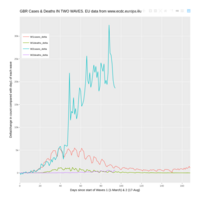
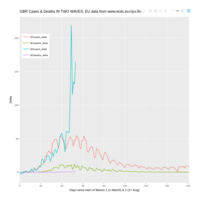
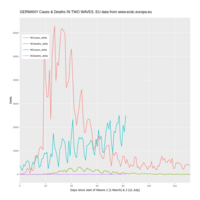
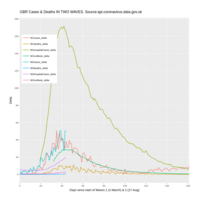
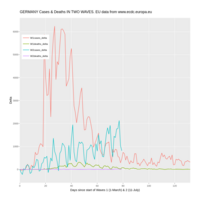
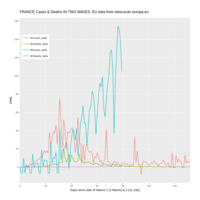
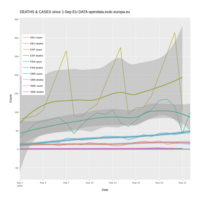
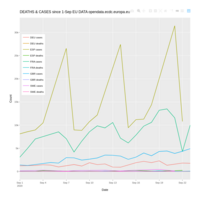
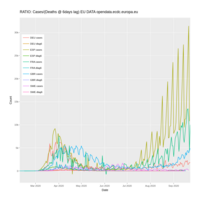
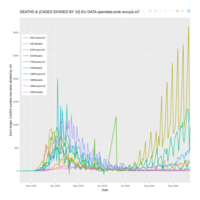
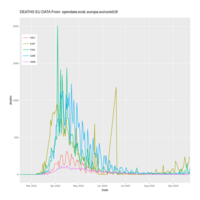
Second Wave?
Data from EU
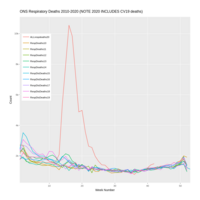
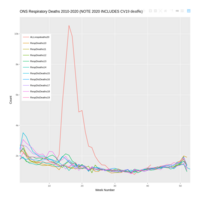
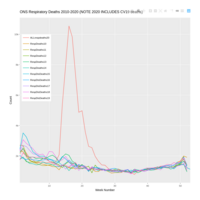
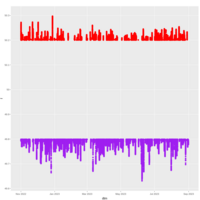
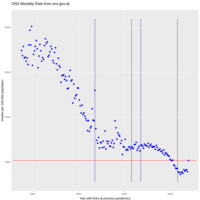
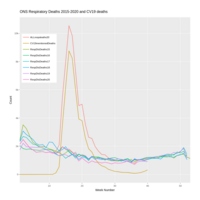
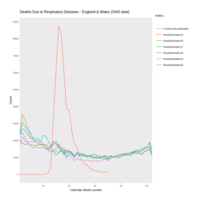
ONS RESPIRATORY DEATHS 2010-2020 (inc CV19)
Source: https://www.ons.gov.uk/peoplepopulationandcommunity/birthsdeathsandmarriages/deaths/datasets/weeklyprovisionalfiguresondeathsregisteredinenglandandwales
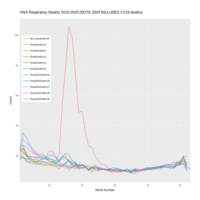
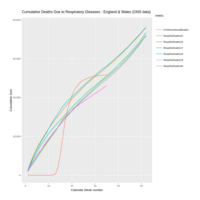
ONS RESPIRATORY DEATHS 2010-2020 (inc CV19)
Source: https://www.ons.gov.uk/peoplepopulationandcommunity/birthsdeathsandmarriages/deaths/datasets/weeklyprovisionalfiguresondeathsregisteredinenglandandwales
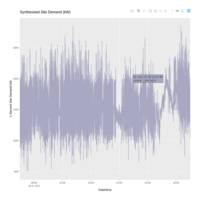
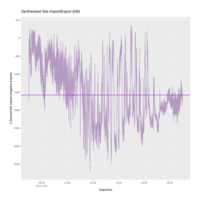
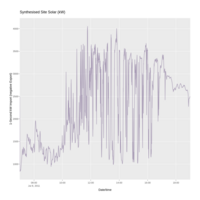
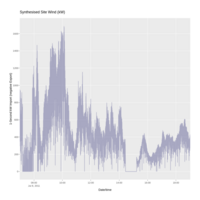
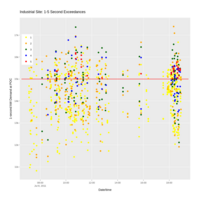
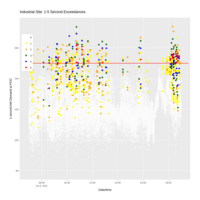
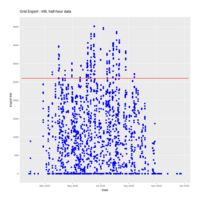
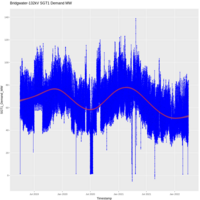
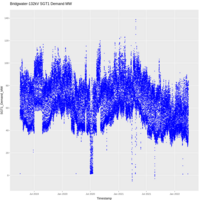
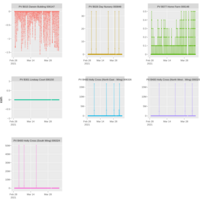
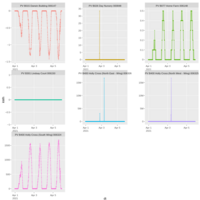
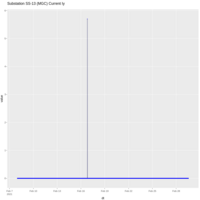
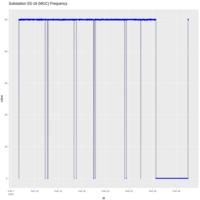
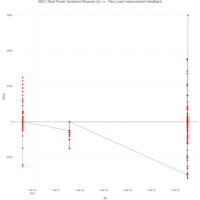
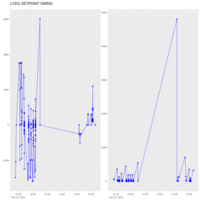
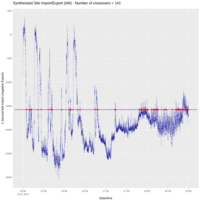
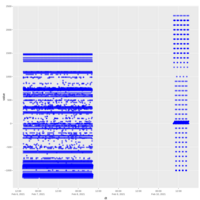
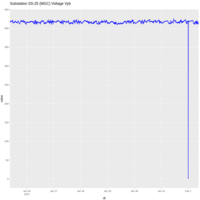
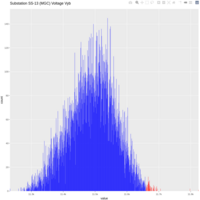
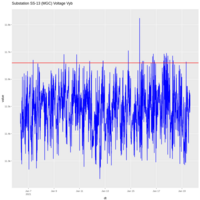
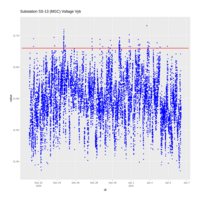
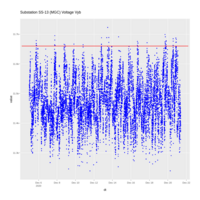
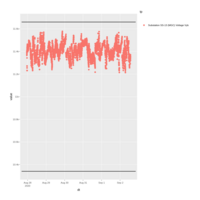
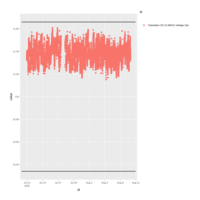
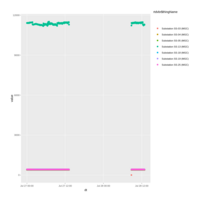
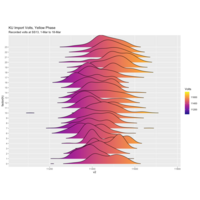
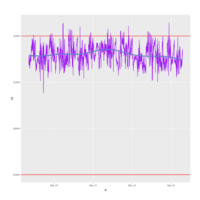
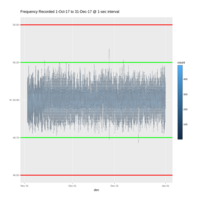
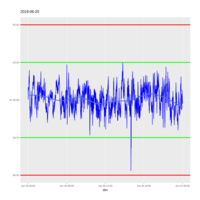
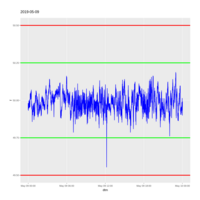
kW Perturbations
Site total demand ~ 8-17 MW
Lagged EU Data
I brought forward death dates by 6 days-- A WORK IN PROGRESS!
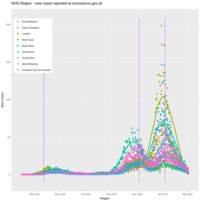
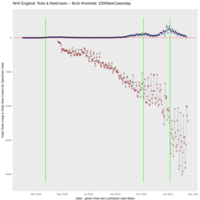
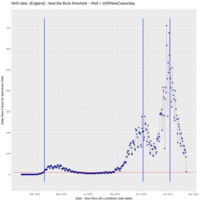
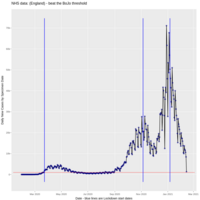
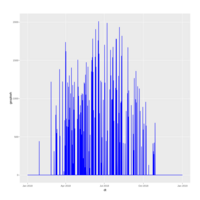
What Spike?
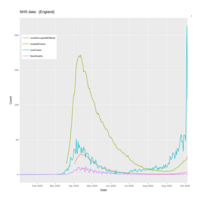
NHS data from
https://api.coronavirus.data.gov.uk
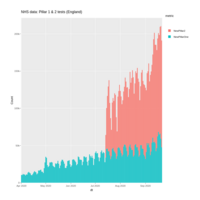
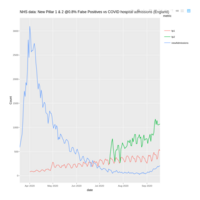
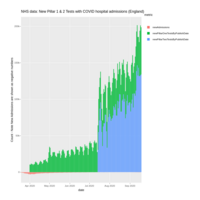
NHS P1, P2, new Admissions
NHS data from their API
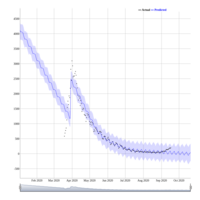
Rough Prophet curve
WARNING: experimental software!
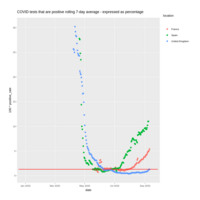
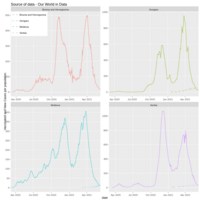
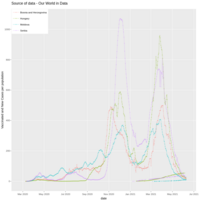
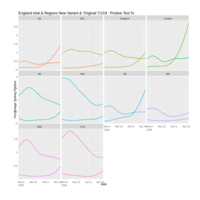
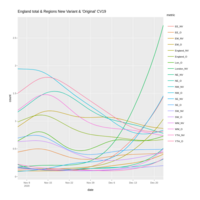
OWID Positive Test Rate
Our World In Data
https://ourworldindata.org/coronavirus/
Facebook CV19 data
Unverified!
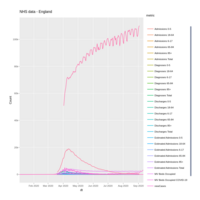
NHS data 3-Sep
Source:
https://www.england.nhs.uk/statistics/wp-content/uploads/sites/2/2020/09/Covid-Publication-10-09-2020.xlsx
ONS Death Data 2015-2020
Unverified data!
ONS death Data 2015-2020
Unverified data! Treat with caution
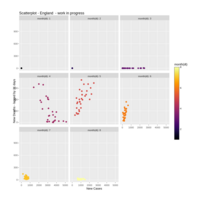
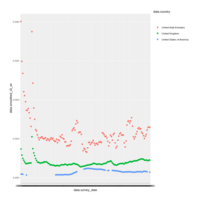
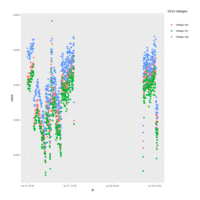
Scatterplot #2
New deaths are 'lagged' by 21 days because that is the typical duration from test-positive to death
CAUTION: unverified data
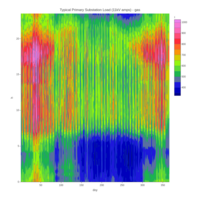
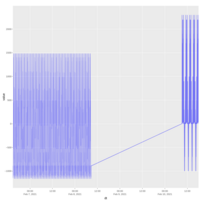
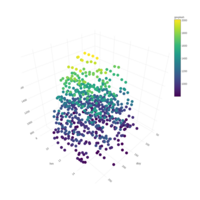
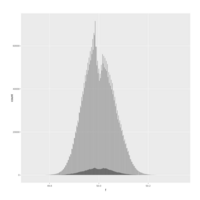
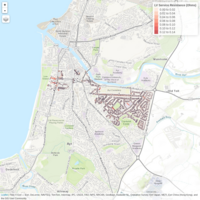
Typical primary s/s load - region with mains gas
X-axis = Day of year (1 - 365)
Y-axis = Hour of day (0 - 24)
Z-axis = Demand (11kV amps) - divide by 52.5 for MW
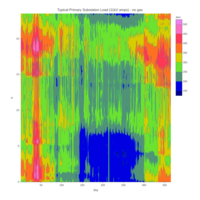
Typical primary s/s load - region without mains gas
X-axis = Day of year (1 - 365)
Y-axis = Hour of day (0 - 24)
Z-axis = Demand (11kV amps) - divide by 52.5 for MW


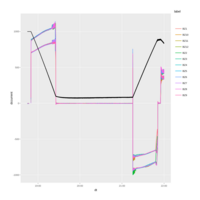
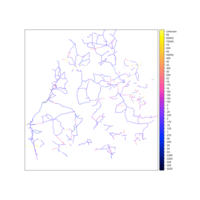
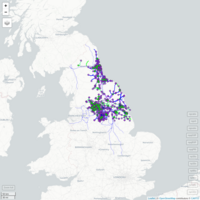
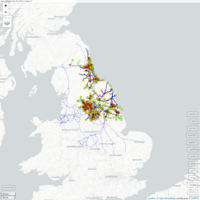
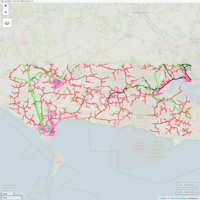
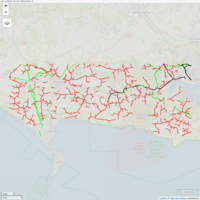
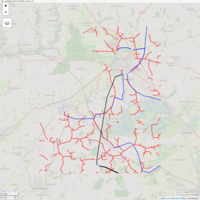
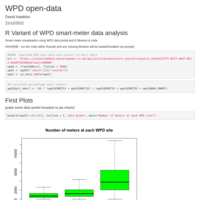
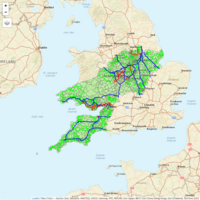
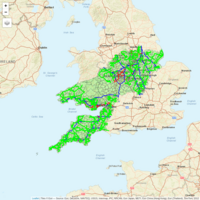
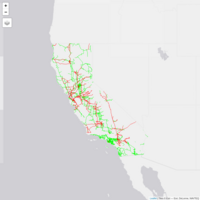
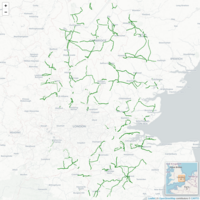
Plot
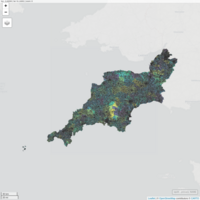
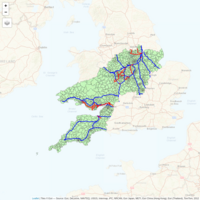
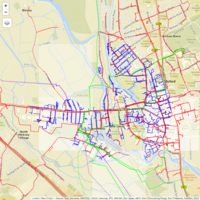
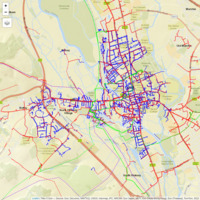
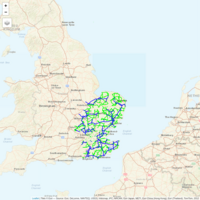
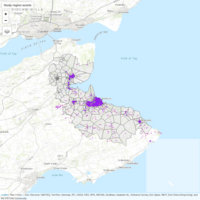
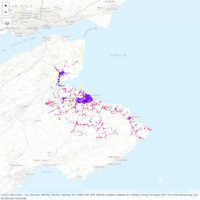
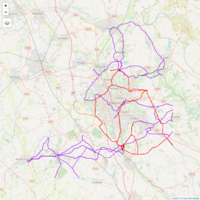
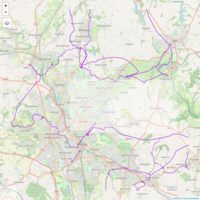
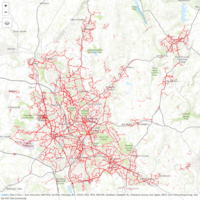
Plot of 33kV overhead line GIS data where conductor size is colour-coded.
Similar approach could be taken with a complex conductor attribute to reflect losses on each circuit, and at each voltage level.
Results can also be summarised in tables where GIS interface is sub-optimal

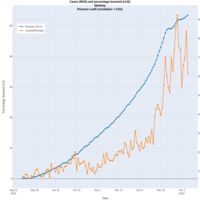
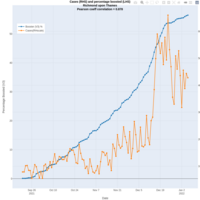
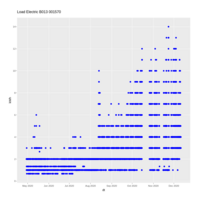
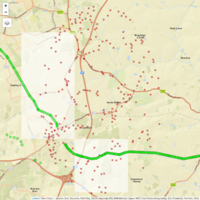
BEIS FiT database 2016 Technology Timeline
Finally got Googlevis working in R
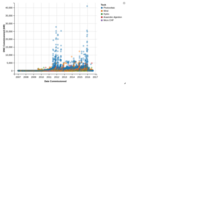
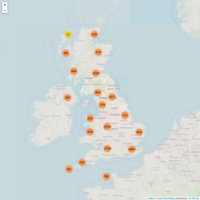
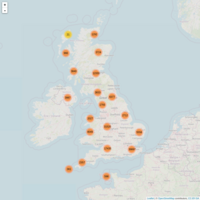
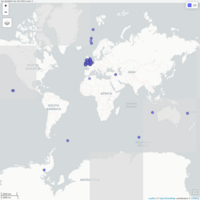
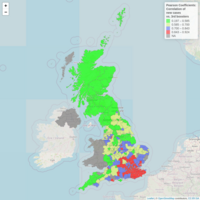
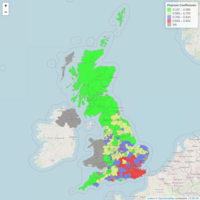
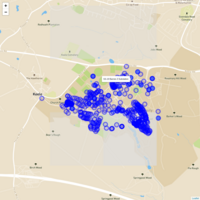
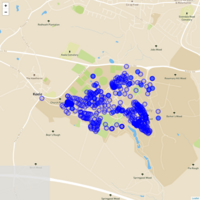
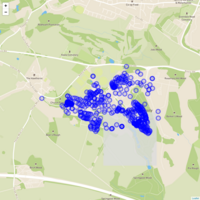
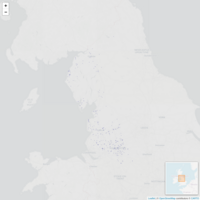
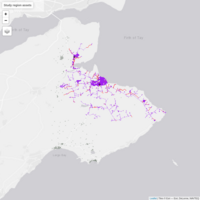
BEIS FiT database 2016
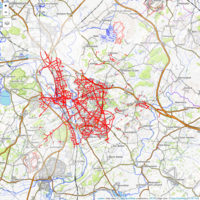
Clustered summary of number of installations on each postcode (outbound postcode only)
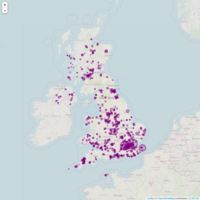
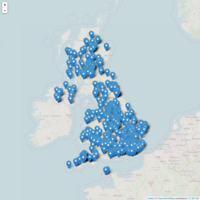
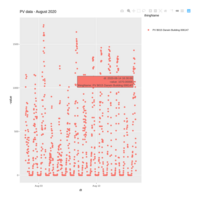
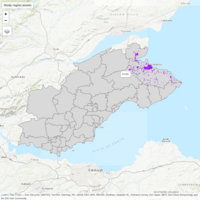
BEIS Feed In Tariff Data 2016
Extracted from BEIS Feed In Tariff .csv files