
deagem
Michael Deagen
Recently Published
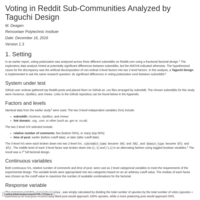
Voting in Reddit Sub-Communities Analyzed by Taguchi Design
Following an earlier analysis on top Reddit posts from three popular subreddits (r/science, r/politics, r/news) with a 2^(6-3) fractional factorial design, this report takes the same Reddit dataset and performs a Taguchi Design using the qualityTools package in R. Exploratory analysis of the full dataset pointed to some differences between factors, however upon constructing a linear model and performing ANOVA based on an 8-run Taguchi Design it was found that none of the main effects were statistically significant. Explanations based on the limitations to highly fractional design are provided and the Taguchi method is compared to the Fractional Factorial Design method.
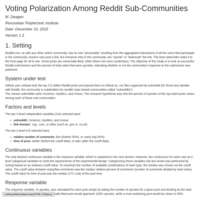
Voting Polarization Among Reddit Sub-Communities
A dataset comprised of the top Reddit posts from three popular subreddits (r/science, r/politics, r/news) were analyzed with a 2^(6-3) fractional factorial design using the FrF2 R package. The objective of this analysis was to identify which factors, if any, led to a significant difference in the amount of upvotes on the post as a percentage of the total number of votes. A tree-like sorting algorithm was developed for sampling from the dataset. Upon constructing a linear model and performing ANOVA it was found that none of the main effects were statistically significant. Explanations based on the model assumptions and limitations to the fractional factorial design are provided along with an explanation of the aliasing structure and generators for the fractional factorial design.
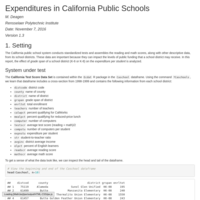
Expenditures in California Public Schools
The California Test Score Data Set from 1998-1999 was used for comparing the average expenditure per student between districts of different grade span (K-6 or K-8). The data were blocked by county to reduce the effect of socioeconomic disparities that might result between districts located in different regions of the state. A function to calculate Cohen's d was used to select the response variable. G*Power software was used to generate an ideal sample size for alpha = 0.05 and power = 0.9. ANOVA using this sample size demonstrated a statistically significant difference in the mean between samples, but the result was shown to be not robust due to violations of the normality assumption of the data. Two alternatives to null hypothesis statistical testing, Resampling and Plot Plus Error Bar, were used to analyze the data.
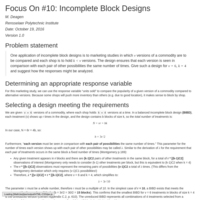
Incomplete Block Designs
Presented is a balanced incomplete block design (BIBD) for a marketing study with v = 6 versions of a commodity, wherein each shop only carries k = 4 versions of the commodity. The experiment is blocked by shop to reduce error variation based on differences between shop sales. R code is presented that generates an experimental design output for an unreduced BIBD for a given v and k.
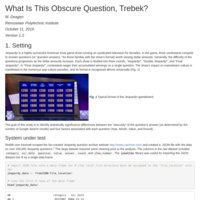
What Is This Obscure Question, Trebek?
In this analysis based on a publicly available dataset of 200,000+ Jeopardy questions, the objective is to determine whether the value of the question is related to the obscurity of the answer. To quantify the response variable of "obscurity" in the 500-question sample pulled from this dataset, a function was implemented that returns the number of Google Search hits for a given answer. Through several 2-factor ANOVA analyses, it was found that the question value did indeed show statistically significant variation in the means with p<<0.05. The 2-factor ANOVA between value and round indicated an almost-significant interaction between value and round.