
dgrtwo
David Robinson
Recently Published
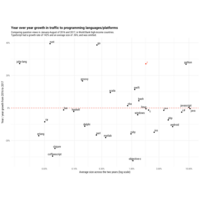
Year over year growth in traffic to programming languages/platforms
Similar to this post, but with "julia-lang" added: https://stackoverflow.blog/2017/09/06/incredible-growth-python/
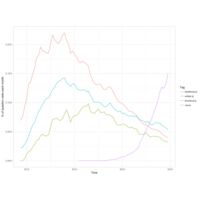
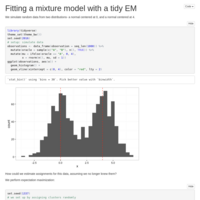
Estimation of the mean generating many samples
Response to a tweet
tidytext notes from Denver R User Group
Live code from the 2017-02-20 Denver R User Group meetup
Mislabeling error
Some simulation of logistic regression with a known rate of mislabeled outcomes. How can the bias be reduced
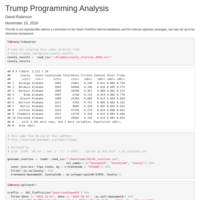
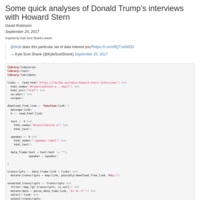
Trump Stack Overflow analysis
Some quick notes leading to some of my tweets. Not reproducible from outside of Stack Overflow
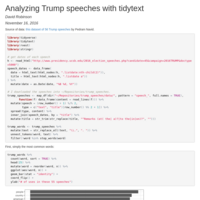
Analyzing Trump speeches with tidytext
Analyzing Trump speeches with tidytext
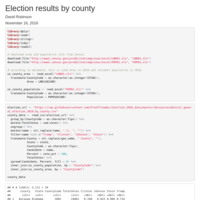
Election results by county
Some processing of election results to add population and area
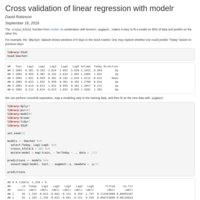
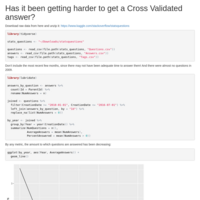
Cross validation with modelr
Cross validation with linear modeling and ISLR stock market data
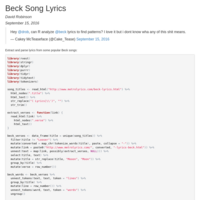
Analysis of Beck lyrics
Analysis of 12 songs
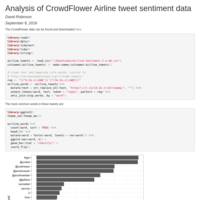
CrowdFlower Airline Sentiment Tweets
Analysis of CrowdFlower Airline tweet sentiment data
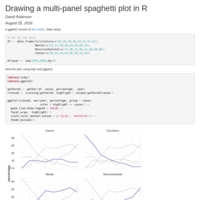
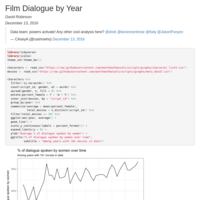
Drawing a multi-panel spaghetti plot in R
Drawing a multi-panel spaghetti plot in R
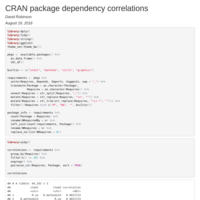
CRAN Package correlations
Network of packages that tend to be SUGGESTS/IMPORTS/DEPENDS on together
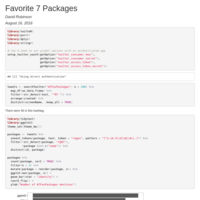
#7FavPackages
Short analysis of #7FavPackages hashtag, still in progress
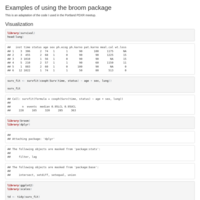
Portland PDXR
This is an adaptation of the code I used to demonstrate broom in the Portland PDXR meetup.
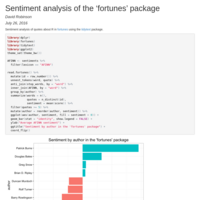
Sentiment analysis of the 'fortunes' package
Sentiment analysis of quotes about R in the fotunes package using the tidytext package.
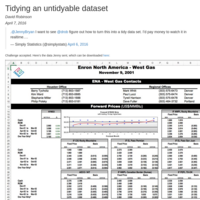
Tidying an untidyable dataset
Tidying an untidyable dataset from the Enron corpus
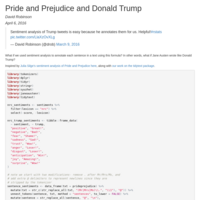
Pride and Prejudice and Donald Trump
Using sentiment analysis with Pride and Prejudice to annotate it with emotions, Trump-style. Great!
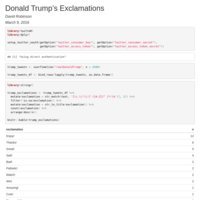
Donald Trump Tweet "Sentiment"
How does Donald Trump end tweets? Interesting!
gganimate Valentine
#rstats valentine made with gganimate
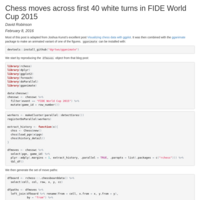
Animation of chess moves across first 40 white turns in FIDE World Cup 2015
Based on Joshua Kunst's post here: http://jkunst.com/r/visualizing-chess-data-with-ggplot/
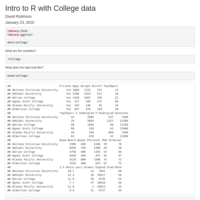
Intro to R with College data
Examples
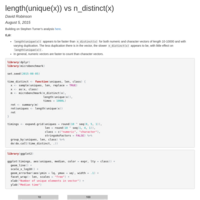
length(unique(x)) vs n_distinct(x)
A speed comparison building on Stephen Turner's.
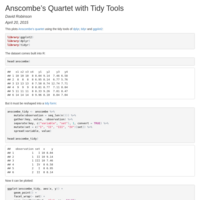
Anscombe’s Quartet with Tidy Tools
This plots Anscombe’s quartet using the tidy tools of dplyr, tidyr and ggplot2.
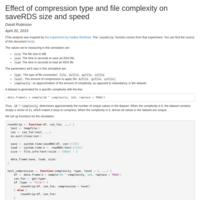
saveRDS
Effect of compression type and file complexity on saveRDS size and speed
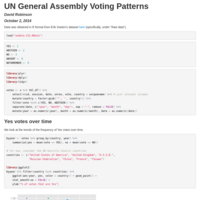
UN Votes
Voting blocs in the UN
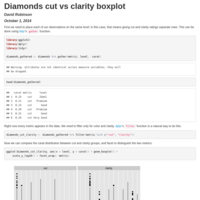
Diamonds cut vs clarity boxplot
Using tidyr and dplyr to compare values across multiple variables

subSeq
Demonstration and application of subSeq software (https://github.com/StoreyLab/subSeq)
Data Analysis and Visualization Using R: Lesson 3
Covers basic statistical analysis, and using data.table on a practical example.
Data Analysis and Visualization Using R: Lesson 2
Slides for Lesson 2 of the Wintersession 2014 Princeton course, on using ggplot2 for data visualization (including scatterplots, histograms, boxplots, and violin plots). Also covers writing functions in R and the list data type.
Data Analysis and Visualization Using R: Lesson 1
Slides for Lesson 1 of the Wintersession 2014 Princeton course, on variables and data structures in R.