
dieguinho01
Diego
Recently Published
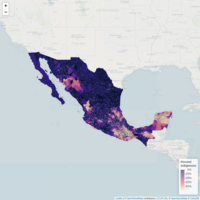
IndigenousPopulationMx
Map of representation of indigenous population in Mexico 2015. Municipality color represents % of the population self proclaimed to be indigenous.
HTML
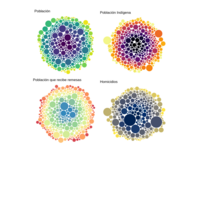
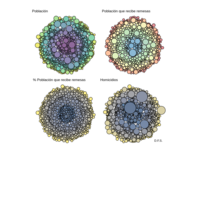
Interactive graphs for Mexico. Data disaggregated at municipality level. Data on homicides, population, indigenous groups and remittances.
HTML
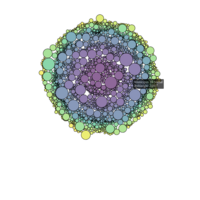
Interactive plots describing the distribution of Mexican municipalities according to population, remittances (number and proportion of people that receive income transfers from abroad, commonly a former family member) and crime. The focus on crime is homicides.
In the plots, the size of the bubble corresponds to the size of the variable at question. So, for example in the top left graph, on population, the area of the bubble represents corresponds to the size of the population at each particular municipality in 2015.
HTML
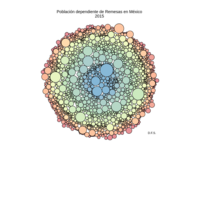
Gráfico interactivo para visualizar las dimensiones de la población dependiente de remesas internacionales como fuente de ingreso en México. Datos elaborados a partir del Censo 2015 de INEGI.
HTML
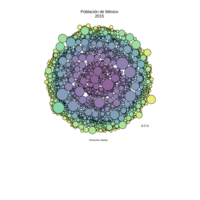
Población de México 2015, por municipio. Gráfico interactivo.
Mexican Population by Municipality (2015)
Population of Mexican Municipalities, Interactive (2015 Census). Circlepack, R