
dimsu
Ralph DTasing
Recently Published
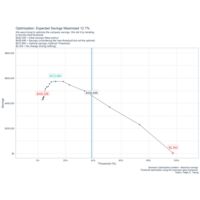
Threshold Optimization (Maximize the savings)
Threshold Optimization using the expected value framework for accounting for the cost/benefits of False Positives and False Negatives
=> This is certainly the most interesting part in Data science ROI driven
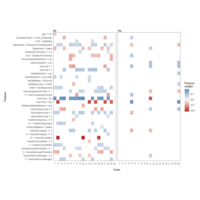
local Interpretable model agnostic explanations plot
This plot from the package LIME : (Local Interpretable Model-Agnostic Explanations). It allows us to :
- Interpret the output of a model (locally for one observation/case)
- The positive indicates it supports the prediction, negative indicates it contradicts the prediction
Combine_plot
This plot shows the combination of important metrics to present to executives
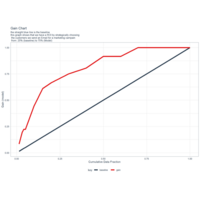
Gain plot
This plot is actually the plot we use should to convince your boss to use a modeling approach.
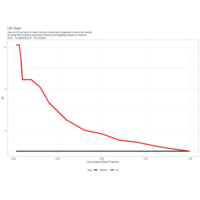
Lift plot
Gain & Lift go hand in hand, the two charts work together to show the results
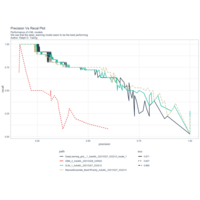
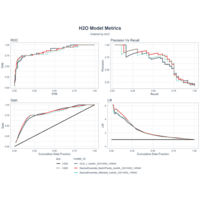
Precision vs Recall plot
With this plot, we gain more insight the outcome of our problem
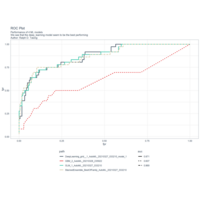
Roc curve
The Roc curve is which plots the True Positive Rate (TPR y-axis) VS False Positive Rate (FPR x-axis)
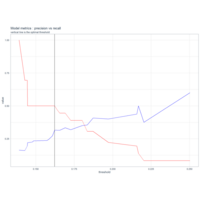
Binary Classification model metrics (Precision Vs Recall)
This plot is a binary classification which shows off the trade-off between the precision (blue line) and the recall (red line)
Exploratory Data Analysis
This graph shows the connection between the employee attrition and compensation features take in account.
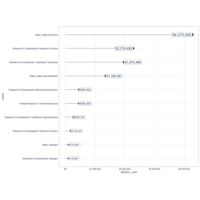
Coût de la démission d'employés d'une compagnie
le graphique représente ce que coûterais en $ le départ d'employés en fonction du statut occupé par celui-ci dans la structure de l'entreprise et du département auquel il est affilié.
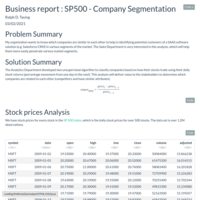
Strategic market intelligence
This report is an interesting case : It gives valuable insights in the SP500 companies which behave similarly based on their stock price. I used here two unsupervised algorithms K-Means & UMAP. Hence your company knows where to find the competion and who is the competion in the market sharing and to the investors.
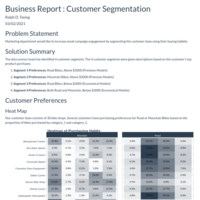
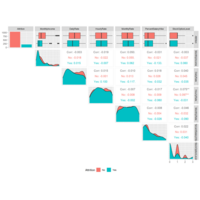
Customer Segmentation
This report is the III part (and last) of my chronicle of business problem. Customer Segmenation is a powerfull technique used to optimize ROI from marketing campaingns and market shares. Hope you enjoyed this small business report.
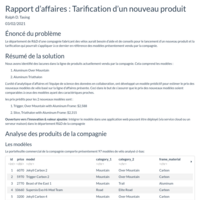
New Product Recommendation (French report)
This report is the II part of my chronicle of business problem. Here I used an unsupervised ML technique called XGBOOST. the aim here is likely to have a predicition of the price of 2 new bike models.
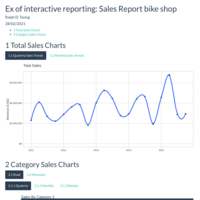
sales report
This report is the I part of my chronicle of business problem solution. Here I used a R programming language combine with Rmarkdown (R reporting) to set up this sales report. Hope that your boss will enjoyed to have a glimpe on that.