Recently Published

Creating Tables in Combination with {tern (+rtables)} and {reporter} R packages
Creating Tables in Combination with {tern (+rtables)} and {reporter} R packages

Creating Tables in Combination with {Tplyr} and {reporter} R packages
Creating Tables in Combination with {Tplyr} and {reporter} R packages

CDISC ARS Overview and Applications of ARD in Practice
CDISC ARS Overview and Applications
of ARD in Practice

Merging More than 2 Data Frames in R in Single Step
Merging More than 2 Data Frames in R in Single Step

Creating Tables in Combination with {tidytlg} and {reporter}
Creating Tables in Combination with {tidytlg} and {reporter}

Creating Tables in Combination with {gtsummary} and {reporter}
Creating Tables in Combination with {gtsummary} and {reporter}

Octagon Tiles
Octagon Tiles

Create Table Shells with R
Create Table Shells with R

Dynamic Lookups in R
Dynamic Lookups in R

Consort Flow Diagram
Consort Flow Diagram

Clinical Reporting with R (II)
Clinical Reporting with R (II)

Bauhaus Art
Bauhaus Art

Squares Tiles
Squares Tiles

Lines Tiles
Lines Tiles

Dots Tiles
Dots Tiles

DocumentPlotting SVG Images with ggplot2 (III)
Plotting SVG Images with ggplot2 (III)

Plotting SVG Images with ggplot2 (II)
Plotting SVG Images with ggplot2 (II)
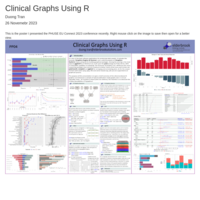
Clinical Graphs Using R
Clinical Graphs Using R
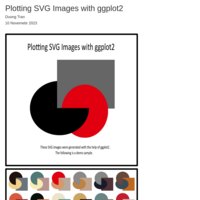
Plotting SVG Images with ggplot2
Plotting SVG Images with ggplot2
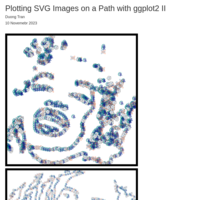
Plotting SVG Images on a Path with ggplot2 II
Plotting SVG Images on a Path with ggplot2 II
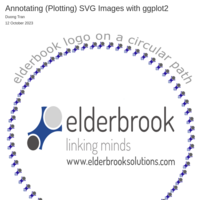
Annotating (Plotting) SVG Images with ggplot2
Annotating (Plotting) SVG Images with ggplot2
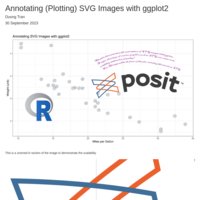
Annotating (Plotting) SVG Images with ggplot2
Annotating (Plotting) SVG Images with ggplot2
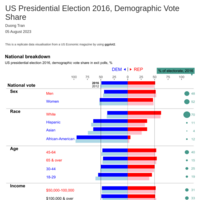
US Presidential Election 2016, Demographic Vote Share
US Presidential Election 2016, Demographic Vote Share
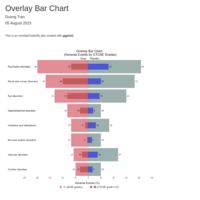
Overlay Bar Chart
Overlay Bar Chart
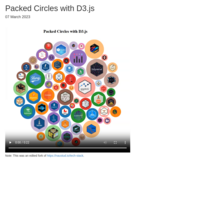
Packed Circles with D3.js
Packed Circles with D3.js
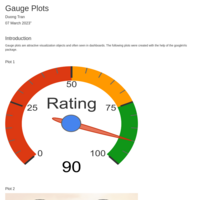
Gauge Plots
Gauge Plots
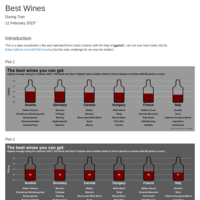
"Best Wine"
"Best Wines"
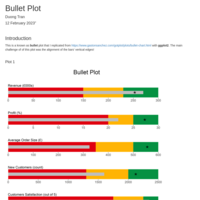
Bullet Plot
Bullet Plot
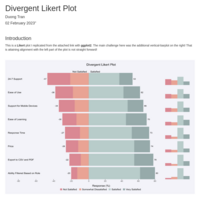
Divergent Likert Plot
Divergent Likert Plot
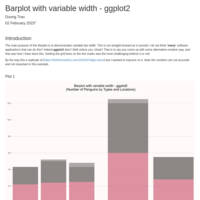
Barplot with variable width - ggplot2
Barplot with variable width - ggplot2
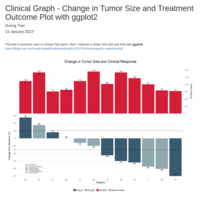
Clinical Graph - Change in Tumor Size and Treatment Outcome Plot with ggplot2
Clinical Graph - Change in Tumor Size and Treatment Outcome Plot with ggplot2
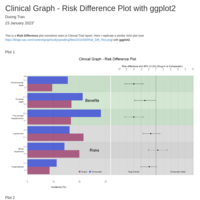
Clinical Graph - Risk Difference Plot with ggplot2
Clinical Graph - Risk Difference Plot with ggplot2
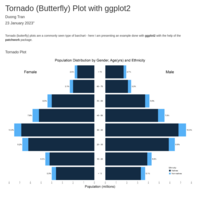
Tornado (Butterfly) Plot with ggplot2
Tornado (Butterfly) Plot with ggplot2
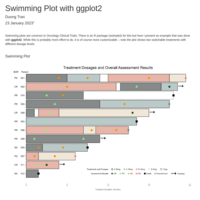
Swimming Plot with ggplot2
Swimming Plot with ggplot2
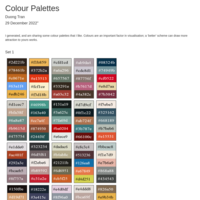
Colour Palettes
Colour Palettes
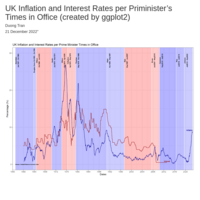
UK Inflation and Interest Rates per Priminister's Times in Office
UK Inflation and Interest Rates per Priminister's Times in Office
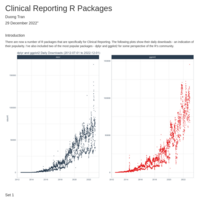
Clinical Reporting R Packages
Clinical Reporting R Packages
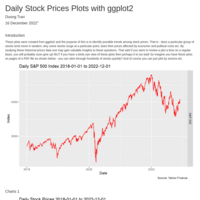
Daily Stock Prices Plots with ggplot2
Daily Stock Prices Plots with ggplot2
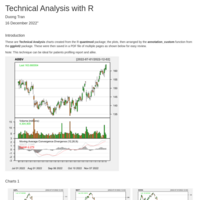
Technical Analysis with R
Technical Analysis with R
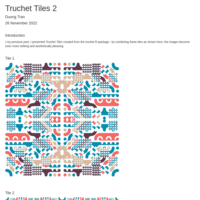
Truchet Tiles 2
Truchet Tiles 2
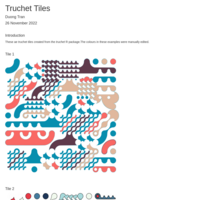
Truchet Tiles
Truchet Tiles
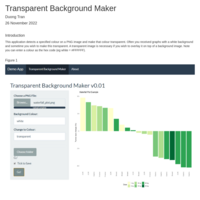
DocumentTransparent Background Maker
Transparent Background Maker
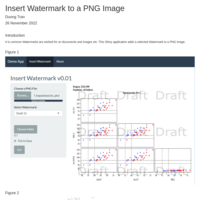
Insert Watermark to a PNG Image
Insert Watermark to a PNG Image
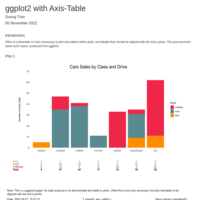
ggplot2 with Axis-Table
ggplot2 with Axis-Table
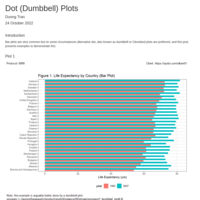
Dot (Dumbbell) Plots
Dot (Dumbbell) Plots
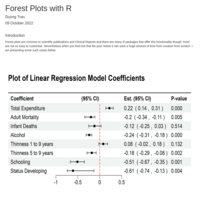
Forest Plots with R
Forest Plots with R
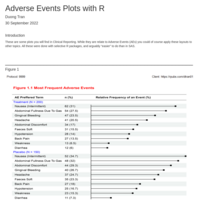
Adverse Events Plots with R
Adverse Events Plots with R
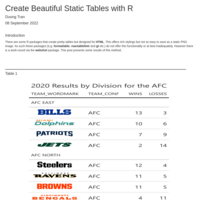
Create Beautiful Static Tables with R
Create Beautiful Static Tables with R
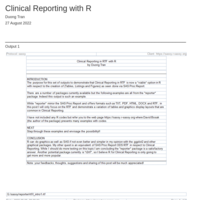
Clinical Reporting with R
Clinical Reporting with R
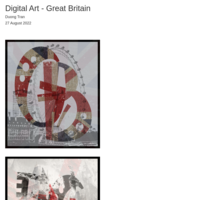
Digital Art - Great Britain
Digital Art - Great Britain
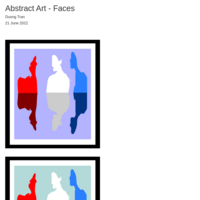
Abstract Art - Faces
Abstract Art - Faces

Abstract Art with Heart Shape and Letters
Abstract Art with Heart Shape and Letters
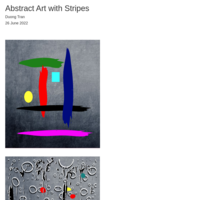
Abstract Art with Stripes
Abstract Art with Stripes
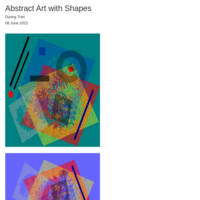
Abstract Art with Shapes
Abstract Art with Shapes
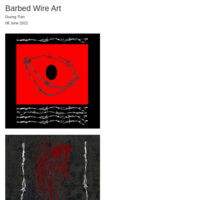
Barbed Wire Art
Barbed Wire Art
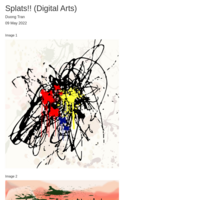
Splats!! (Digital Arts)
Splats!! (Digital Arts)
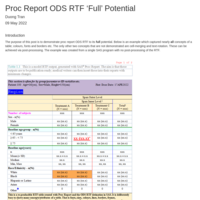
Proc Report ODS RTF 'Full' Potential
Proc Report ODS RTF 'Full' Potential
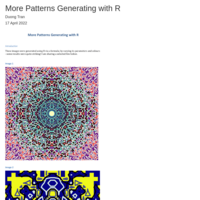
More Patterns Generating with R
More Patterns Generating with R
DocumentDefine your Own SAS Command Line Commands
Define your Own SAS Command Line Commands
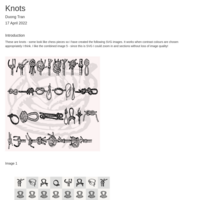
Knots
Knots
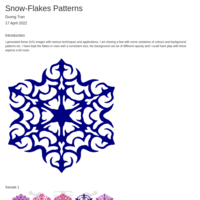
Snow-Flakes Patterns
Snow-Flakes Patterns
Proc Report Header and Footer Lines
Proc Report Header and Footer Lines
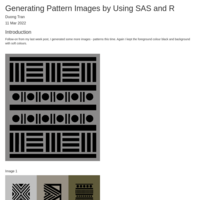
Generating Pattern Images by Using SAS and R
Generating Pattern Images by Using SAS and R
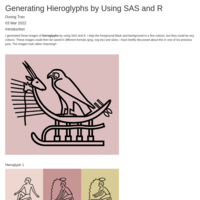
Generating Hieroglyphs by Using SAS and R
Generating Hieroglyphs by Using SAS and R
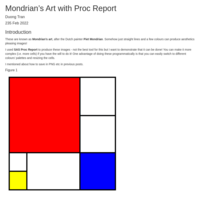
Mondrian's Art with Proc Report
Mondrian's Art with Proc Report
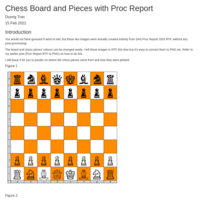
Chess Board and Pieces with Proc Report
Chess Board and Pieces with Proc Report
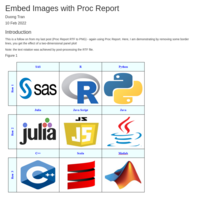
DocumenEmbed Images with Proc Report
Embed Images with Proc Report
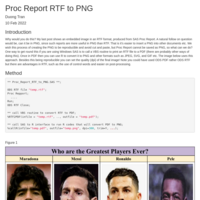
Proc Report RTF to PNG
Proc Report RTF to PNG
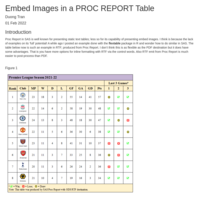
Embed Images in a PROC REPORT Table
Embed Images in a PROC REPORT Table

A Novel Approach to Patient Profiling
A Novel Approach to Patient Profiling
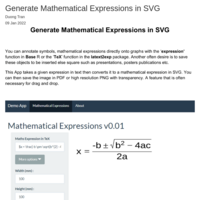
Generate Mathematical Expressions in SVG
Generate Mathematical Expressions in SVG
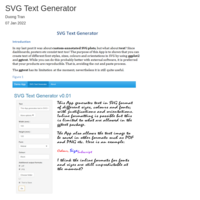
SVG Text Generator
SVG Text Generator
Custom Annotate SVG Images with ggplot2
Custom Annotate SVG Images with ggplot2
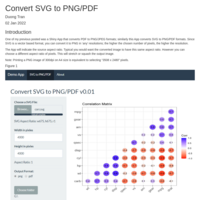
Convert SVG to PNG/PDF
Shiny App to Convert SVG to PNG/PDF
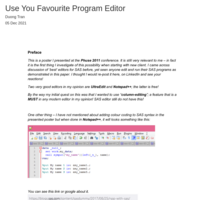
Use Your Favourite Program Editor
Use Your Favourite Program Editor for SAS
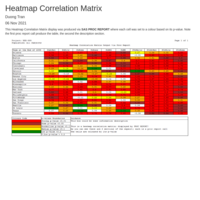
Heatmap Correlation Matrix
Heatmap Correlation Matrix
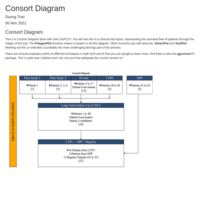
Consort Diagram
Consort Diagram
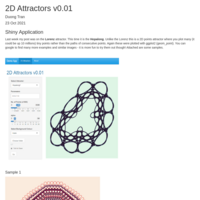
2D Attractors
2D Attractors Generator
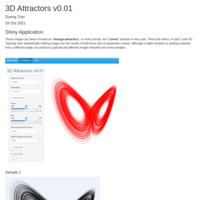
3D Attractors v0.01
3D Attractors Generator
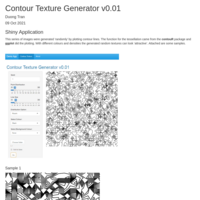
Contour Texture Generator v0.01
Contour Texture Generator
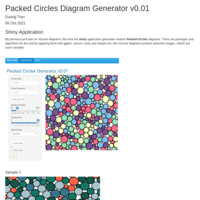
Packed Circles Diagram Generator v0.01
Packed Circles Diagram Generator v0.01
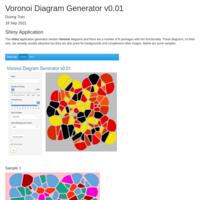
Voronoi Diagram Generator v0.01
Voronoi Diagram Generator
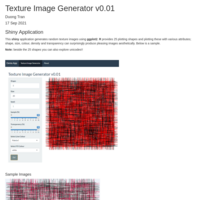
Texture Image Generator
Shiny application to generate random texture images
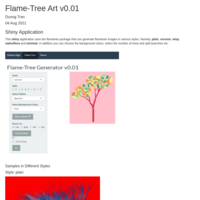
Flame-Tree Art v0.01
Shiny application to generate Flame-Tree art
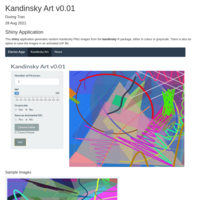
Kandinsky Art v0.01
Shiny application to generate Kandinsky art
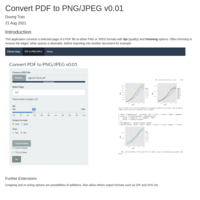
Convert PDF to PNG/JPEG v0.01
Convert a selected PDF page to PNG or JPEG
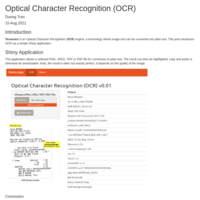
Optical Character Recognition (OCR)
Convert image text to plain text
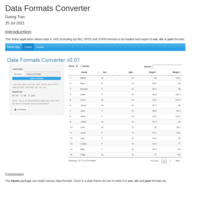
Data Formats Converter
A Shiny App to Convert Data Formats
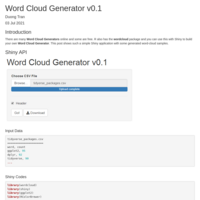
Word Cloud Generator
Generate Word Cloud
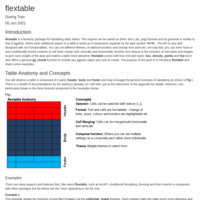
flextable
Introduction to some flextable features
Mixing SAS and R Plots
Mixing SAS and R Plots
Calling R from Windows SAS
Calling R from Windows SAS
Reading Raw Data
Reading raw data
Clinincal Graphs with ggplot2
This is a blog of a sample of clinical graphs created with ggplot2
