
dvdunne
Dave Dunne
Recently Published
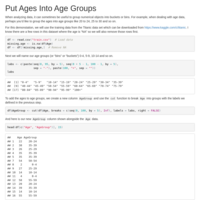
Put Ages Into Age Groups
Group the ages into age groups like 20 to 24, 25 to 30 and so on.
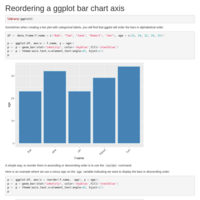
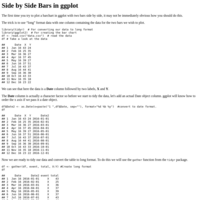
Side by Side Bars in ggplot
Plotting a bar chart in ggplot with two bars side by side.
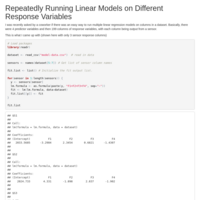
Repeatedly Running Linear Models on Different Response Variables
An easy way to run linear regression models on multiple response columns in a dataset
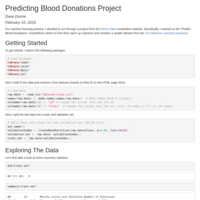
Predicting Blood Donations
The Predict Blood Donations project from drivendata.org
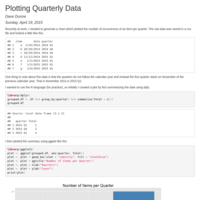
Plotting Quarterly Data When There Are Quarters With No Data
Attempting to plot data for quarters when some of the data are zero.