
ejsbrocco_ncpol
EJ Sbrocco
Recently Published
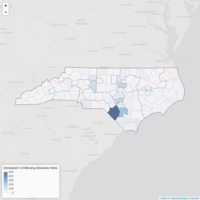
Estimated # of Missing Absentee Voters - Mapped
Estimates are from a linear model that predicts the number of ballot requesters who did not vote as a function of number of ballots requested by county and congressional district. The model estimate assumes that non-voting rates among counties/congressional districts does not vary. Data: NCSBE, Analytics: @ejsbrocco
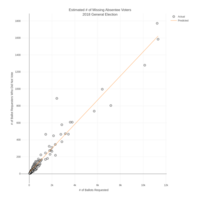
Estimated # of Missing Absentee Voters
Estimates are from a linear model that predicts the number of ballot requesters who did not vote as a function of number of ballots requested by county and congressional district. The model estimate assumes that non-voting rates among counties/congressional districts does not vary. Data: NCSBE, Analytics: @ejsbrocco
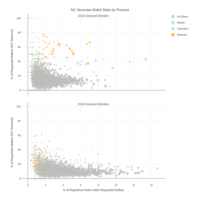
NC Absentee Ballot Stats by Precinct in 2018 vs 2016
% of registered voters who requested mail-in absentee ballots versus % of requested ballots returned to the NCSBE (regardless of whether they were accepted or not).
All data: NCSBE,
Analysis: @ejsbrocco
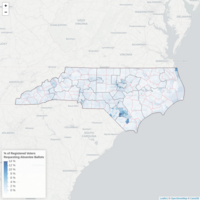
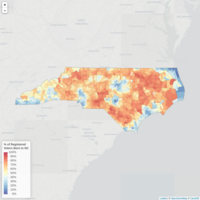
Absentee Ballot Request Rate, 2018 General Election
Percentage of active registered voters who requested a mail-in absentee ballot in the 2018 November general election. Congressional districts are outlined in black, counties outlined in red. Data Source: NCSBE, Analytics: @ejsbrocco
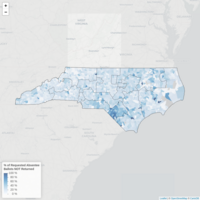
Absentee Ballot Failure to Return Rate, 2018 General Election
Percent of requested mail-in absentee ballots that were not returned by NC precinct in the 2018 November general election. Congressional districts are also outlined. Data Source: NCSBE, Analytics: @ejsbrocco
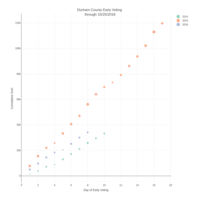
Durham Early Voting through 10/25/2018
All voters, versus 2014 and 2016.
Source: NCSBE
Analytics: EJ Sbrocco, @ejsbrocco
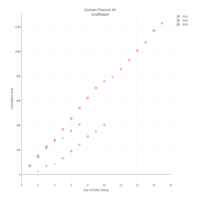
Durham Precinct 44, Unaffiliated
last updated: Day 7
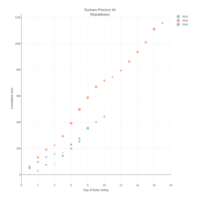
Durham Precinct 44, Republicans
last updated: Day 7
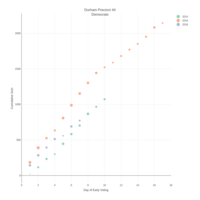
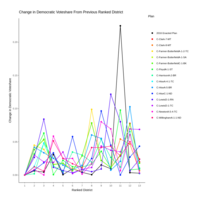
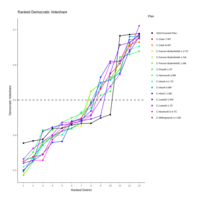
Durham Precinct 44, Democrats
last updated: Day 7
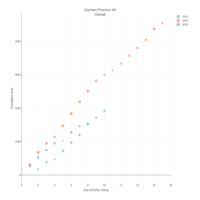
Durham Precinct 44, Overall
last updated: day 7
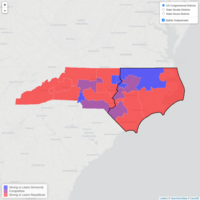
NC Partisan Ratings vs Subpoenaed Ballots
Partisan ratings of NC Congressional and Legislative districts and outline of 44 counties that have been subpoenaed by the DOJ/ICE for voter's ballots over the last 5 years.
For the Congressional map, competitive districts are those classified as "Swing Districts" by SwingLeft (https://swingleft.org/district-resources). Otherwise, rating is based on party membership of the person representing the district.
For Legislative maps, partisan district ratings follow classifications by NCFEF (https://www.ncfef.org/copy-of-research-analysis), except that "lean and strong" partisan ratings were merged for map simplification.
Maps by @ejsbrocco.
% of Registered Voters Born in NC by Precinct (as of 8/26/2018)
Percentage of active and inactive registered voters in North Carolina precincts who were born in NC. Voters who did not indicate a place of birth were removed from the analysis. Note that precinct shapes have been simplified for web-viewing and may vary slightly from actual boundaries.
Data Source: NC State Board of Elections, downloaded 8/26/2018
Map and analytics: EJ Sbrocco
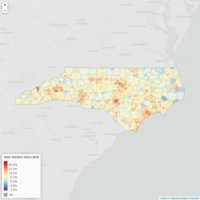
NC Voter Attrition by VTD Since 2016
Percentage of November 2016 voters who are no longer registered in the same precinct as of July 10, 2018.
Data Source: NCSBE.
Map and Analytics: @ejsbrocco
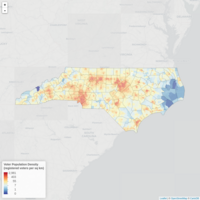
Voter Population Density
Population density of registered voters by VTD, excluding inactive except by reason of confirmation not returned (voters per square kilometer).
Data source: NCSBE, July 17, 2018
Map and analytics: @ejsbrocco
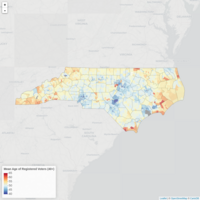
Mean Age of Registered Voters (ages 40+) by Voting District
VTD's with mean ages less than 40 are shown in gray.
Data Source: NCSBE, July 16, 2018
Map and analytics: @ejsbrocco
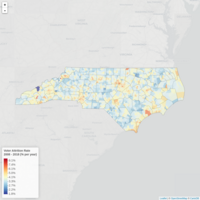
Voter Attrition Rate 2008 - 2018
Rate of Voter Attrition, Nov 2008 - July 2018.
Voter attrition rate was calculated as such:
1) Calculate the percentage of November Federal general election voters (i.e., November of 2008, 2010, 2012, 2014, and 2016) who are still registered in the same voting district (VTD) as of July 10, 2018.2) Calculate attrition since each election as one minus the percentage of voters still registered.
3) Calculate the slope through these values to obtain per year attrition rate.
Note that voters were considered to be "registered" for the purposes of this analysis if they are listed as "active" or "inactive" by reason of "confirmation not returned." The slope calculated in Step 3 is plotted here.
All data from NCSBE. VTD and County shapefiles from NC Legislative Redistricting archives. Map and analytics by @ejsbrocco.
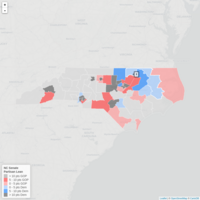
NC State Senate - Partisan Lean
Based on a weighted average of the 2016 Dem and GOP votes for NC Governor, Lieutenant Governor, Attorney General, and Commissioner of Agriculture. These "indicator races" perfectly predicted the outcomes in contested NC House and State Senate contests in 2016.
Districts are from Special Master Nathaniel Persily's maps.
Updated 2/8/2018
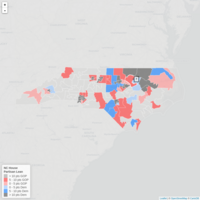
NC House - Partisan Lean
Based on a weighted average of the 2016 Dem and GOP votes for NC Governor, Lieutenant Governor, Attorney General, and Commissioner of Agriculture. These "indicator races" perfectly predicted the outcomes in contested NC House and State Senate contests in 2016.
Districts are from Special Master Nathaniel Persily's maps EXCEPT for in Wake and Mecklenburg Counties; districts here were drawn by the NCGA in 2017.
Updated 2/8/2018