
elaliberte
Etienne Laliberté
Recently Published
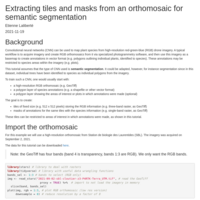
Extracting tiles and masks from an orthomosaic for semantic segmentation
This tutorial shows how to extract tiles and masks from an orthomosaic ahead of training a convolutional neural network (CNN) for semantic segmentation. To train such a CNN, one would usually start with:
* a high-resolution RGB orthomosaic (e.g. GeoTiff)
* a polygon layer of species annotations (e.g. a shapefile or other vector format)
* a polygon layer showing the areas of interest or plots in which annotations were made (optional)
The goal is to create:
* tiles of fixed size (e.g. 512 x 512 pixels) storing the RGB information (e.g. three-band raster, as GeoTiff)
* masks of annotations for the same tiles with the species information (e.g. single-band raster, as GeoTiff)
These tiles can be restricted to areas of interest in which annotations were made, as shown in this tutorial.
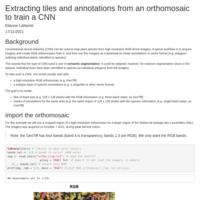
Extracting tiles and masks from an orthomosaic to train a CNN
This tutorial shows how to extract tiles and masks (annotations) from a high-resolution RGB orthomosaic and a layer of polygon annotations to train a convolutional neural network (semantic segmentation). This tutorial only shows the data processing steps.
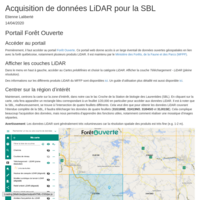
Acquisition de données LiDAR pour la SBL
Tutoriel expliquant la procédure pour télécharger des données LiDAR (e.g. modèle numérique de terrain, modèle de hauteur de canopée) pour la Station de biologie des Laurentides (SBL) de l'Université de Montréal (UdeM) à partir du portail Forêt Ouverte du MFFP, et ce à partir de R.
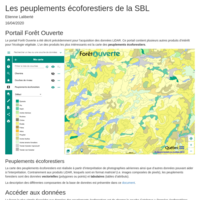
Les peuplements écoforestiers de la SBL
Acquisition des données de peuplements écoforestiers de la Station de biologie des Laurentides (SBL) de l'Université de Montréal (UdeM) à partir du portail Forêt Ouverte, en utilisant R.
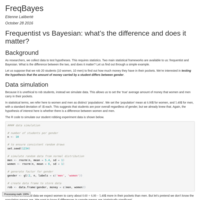
Frequentist or Bayesian?
This article explains the difference between the frequentist and Bayesian statistical frameworks through a simple example.
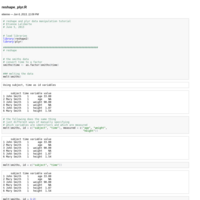
Data manipulation: the reshape2 and plyr packages
A tutorial on how to manipulate data with the reshape2 and plyr packages
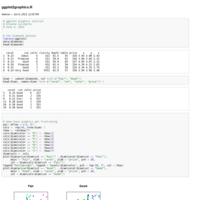
ggplot2: overview
An introduction to the powerful ggplot2 graphics package for R.
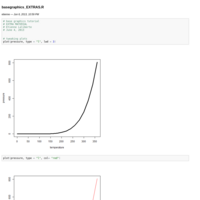
R base graphics: extras
Shows how to make some more advanced plots with base graphics, focusing on types of plots that cannot be made easily with ggplot2. Also, introduces some graphical parameters and methods to print multiple graphs per device.
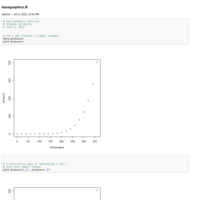
R base graphics: overview
An overview of some basic features of R graphics:
- scatterplots
- window and file devices
- switching between devices