enzedonline
Richard Allen
Recently Published
Johns Hopkins University Data Science Capstone Project Milestone Report
The following report examines the data required for the Johns Hopkins Data Science Specialization Capstone Project and explores plans for creating a word prediction app. Of three model types trialled (Recursive Neural Network with TensorFlow, Markov Chain Prediction and Stupid Back-off), the report will find the Stupid Back-off approach to be the best performer in terms of accuracy, speed and size, and simplest to create.

New Zealand Earthquake App
Mock pitch presentation for NZ earthquake app developed in Shiny (see https://github.com/enzedonline/shiny-app-demo). 3D interactive surface map using plotly.
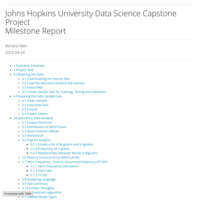
Queenstown Day Hikes
Demo using the Leaflet interactive mapping library (see code below map). The map shows a selection of day hikes around Queenstown, New Zealand of varying grades. Click the marker to reveal name and duration of hike and link to Google Maps.
Qualitative Activity Recognition of Weight Lifting Exercises
Using devices such as Jawbone Up, Nike FuelBand, and Fitbit it is now possible to collect a large amount of data about personal activity relatively inexpensively. These type of devices are part of the quantified self movement – a group of enthusiasts who take measurements about themselves regularly to improve their health, to find patterns in their behavior, or because they are tech geeks. One thing that people regularly do is quantify how much of a particular activity they do, but they rarely quantify how well they do it.
The goal of this project is to use data from accelerometers on the belt, forearm, arm, and dumbell of 6 participants and predict what class of activity was taking place based on the predictor variables in the data set.
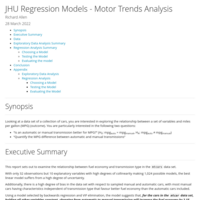
JHU Regression Models - Motor Trends Analysis
This report sets out to examine the relationship between fuel economy and transmission type in the mtcars data set. Using a model selected by backwards regression and VIF elimination, the model suggests that, for the cars in the mtcar data set, holding all other variables constant, changing from automatic to manual transmission will increase the fuel economy by 2.15 mpg. However, with a residual standard error of 2.308, the null hypothesis that transmission has no effect on fuel economy is failed to be rejected.
Statistics with R Capstone - Linear Modelling
Comparison of BMI, Lasso and Bayesian Highest Probability models. Variable selection criteria and testing, validation analysis.
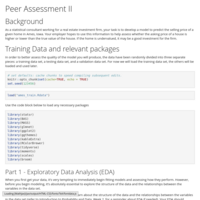
Statistics with R Capstone - EDA and Basic Model Selection
EDA and house price prediction using Bayesian BPM model selection.
Applying a basic correction factor as a square of distance from median to bring the tails of predicted data into line with observed.
Inferential Data Analysis on the ToothGrowth dataset
Part 2 of the final assessment project for the John Hopkin's University Statistical Inference course, the 6th in the Data Science Specialization.
Part 2 is a basic demonstration of making inferences from small data sets. Using R's ToothGrowth dataset which represents a study of the effect of Vitamin C on tooth growth in 60 guinea pigs
The report makes use of T-Tests to make conclusions about relationships between tooth growth, supplement type and dosage level.
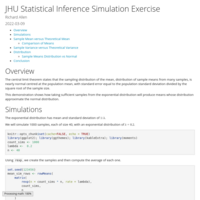
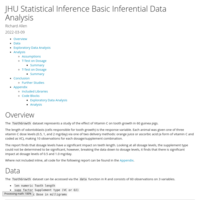
Sampling the exponential distribution to demonstrate the central limit theorem
Part 1 of the final assessment project for the John Hopkin's University Statistical Inference course, the 6th in the Data Science Specialization.
Part 1 is a basic analysis to demonstrate the central limit theorem states that the sampling distribution of the mean, distribution of sample means from many samples, is nearly normal centred at the population mean, with standard error equal to the population standard deviation divided by the square root of the sample size.
This demonstration shows how taking sufficient samples from the exponential distribution will produce means whose distribution approximate the normal distribution.
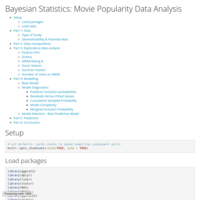
Bayesian Statistics: Movie Popularity Data Analysis
Final assessment project for the Duke University course on Bayesian Statistics, course #4 of the Statistics with R Specialization professional certification.
The task is a not-so-serious look at multi-linear regression using Bayesian principles to predict movie ratings on Rotten Tomatoes.
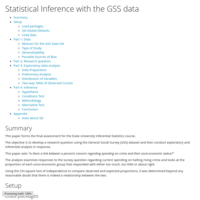
Statistical Inference with the GSS data
This paper forms the final assessment for the Duke University Inferential Statistics course.
The objective is to develop a research question using the General Social Survey (GSS) dataset and then conduct exploratory and inferential analysis in response.
This paper asks “Is there a link between a person’s concern regarding spending on crime and their socio-economic status?”
The analysis examines responses to the survey question regarding current spending on halting rising crime and looks at the proportion of each socio-economic group that responded with either too much, too little or about right.
Using the Chi-square test of independence to compare observed and expected proportions, it was determined beyond any reasonable doubt that there is indeed a relationship between the two.
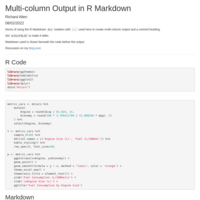
Multi-column Output in R Markdown
Demo of using the R Markdown div notation with ::: used here to create multi-column output and a centred heading. Set echo=FALSE to make it tidier. Markdown used is shown beneath the code before the output.
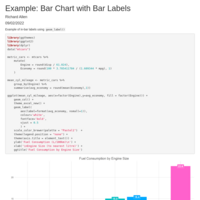
Example: Bar Chart with Bar Labels
Example of in-bar labels using geom_label()
Exploring the BRFSS data
The following report is an exercise as part of the Duke University Introduction to Probability and Data with R course as part of the Statistics with R Specialization.
The study uses the 2013 Behavioral Risk Factor Surveillance System (BRFSS) processed data.
Analysis of Health and Economic Impact of Reported Severe Weather Events Across USA
The report addresses two questions:
Across the United States, which types of events are most harmful with respect to population health?
Across the United States, which types of events have the greatest economic consequences?