
friendly
Michael Friendly
Recently Published
Coefficient plots for linear models
Examines methods for plotting coefficients of linear models in R
Coefficient plots for linear models
Demonstration of ways to plot coefficients in linear models

Software tools for research, teaching and writing
A collection of software tools I use for bibliographies, equations and tables
Grid approximation example
This works through some examples of grid approximation from McElrath, Statistical Rethinking, 2.4.3
Testing seriation
This script uses some examples to test how/whether the seriation package can be used to simplify mosaic displays. It uses some recent enhancements from Michael Hahsler.

Quarto: Test LaTeX newcommands in HTML doc
This document describes several tests of LaTeX equations using mathjax features of \newcommand

Quarto: Test LaTeX newcommands in HTML doc
This document describes several tests of LaTeX equations using mathjax features of \newcommand

Network diagram of EDA geneaology
This script recreates a network diagram showing the genealogy of those involved in the development of Exploratory Data Analysis following John W. Tukey, Frederick Mosteller, Harold Gulliksen and others, together with
some of their students.
Quetelet's Propensity Puzzles
This document explores some questions related to Quetelet's 1831 _Research on the Propensity for Crime at Different Ages

Coefficient plots for linear models
This example considers coefficient plots for regression models and illustrates the effect of scaling of predictors on what you can see.
Logistic regression: NES 92
Logistic regression modeling political preference given income
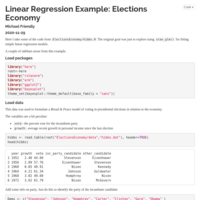
Linear Regression Example: Elections Economy
Here I start with some of the code from `ElectionsEconomy/hibbs.R`.
The original goal was just to explore using `stan_glm()` for fitting simple
linear regression models. A couple of sidebars arose from this example.
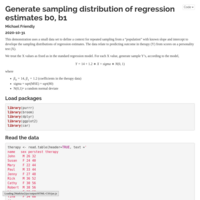
Generate sampling distribution of regression estimates
This demonstration uses a small data set to define a context for repeated
sampling from a "population" with known slope and intercept to develop the
sampling distributions of regression estimates.

Penguins data: MANOVA and HE plots
This vignette illustrates the use of MANOVA, HE plots and canonical discriminant analysis in the analysis of the Palmer penguins data
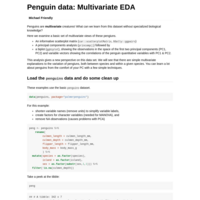
Penguin data: Multivariate EDA
These examples show the use of multivariate exploratory visualization methods -- principal component analysis and biplots -- to understand the relations among variables in the penguins data set.

Visualizing Multivariate Linear Models in R: Iris Examples
This article illustrates some graphical methods that we have developed over the last ten years that aid in the understanding and communication of the results of multivariate linear models (Friendly 2007; Friendly, Monette, and Fox 2013). Just as a boxplot is a visual summary of the mean and variance of a 1D sample, these methods rely on data ellipsoids as simple, minimally sufficient visualizations of means and (co-)variance that can be shown in 2D and 3D plots.
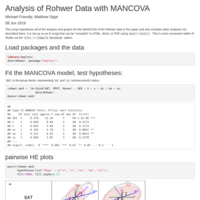
Analysis of Rohwer Data with MANCOVA -- HE plots
This script is part of supplementary materials in conjunction with the paper "Graphical Methods for Multivariate Linear Models in Psychological Research", Michael Friendly & Matthew Sigal (submitted).
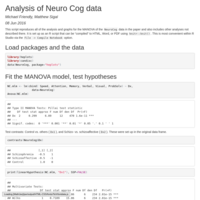
Analysis of Neuro Cog data -- HE plots cand canonical analysis
This script is part of supplementary materials in conjunction with the paper "Graphical Methods for Multivariate Linear Models in Psychological Research", Michael Friendly & Matthew Sigal (submitted).
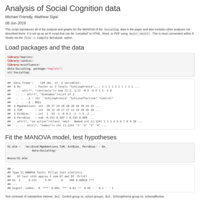
Analysis of Social Cognition data - HE plots and canonical analysis
This script is part of supplementary materials in conjunction with the paper "Graphical Methods for Multivariate Linear Models in Psychological Research", Michael Friendly & Matthew Sigal (submitted).
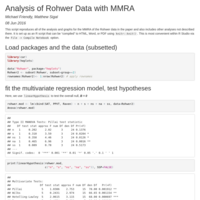
Analysis of Rohwer Data with MMRA -- HE plots and canonical correlation analysis
This script is part of supplementary materials in conjunction with the paper "Graphical Methods for Multivariate Linear Models in Psychological Research", Michael Friendly & Matthew Sigal (submitted).