
grigory
Gregory E Kanevsky
Recently Published
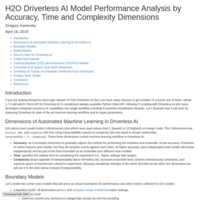
H2O Driverless AI Model Analysis by Searching Automated ML Dimensions
DAI places each model inside 3-dimensional cube where axes span values from 1 (lowest) to 10 (highest) on integer scale. Searching for the best model across the 3 dimensions for accuracy, time, and complexity is described in this post.
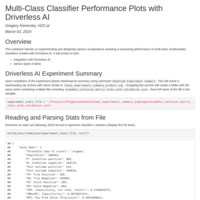
Multi-Class Classifier Performance Plots with Driverless AI
This notebook intends on experimenting and designing various visualizations assisting is assessing performance of multi-class (multivariate) classifiers created with Driverless AI. It will evolve in both:
- integration with Driverless AI
- various types of plots
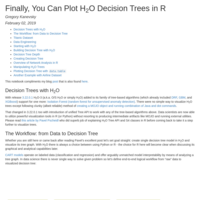
Finally, You Can Plot H2O Decision Trees in R
Plotting H2O decision trees became much simpler with release 3.22 thanks to new Tree API working with all decision tree- based algorithms in H2O. The main workflow of designing and creating a single decision tree in R below is capped with visualization techniques for displaying trees in R.
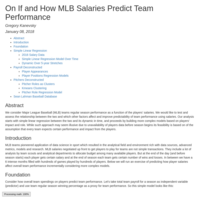
MLB Team Performance vs. Player Salary Regression Models
We consider Major League Baseball (MLB) teams regular season performance as a function of the players’ salaries. We would like to test and assess the relationship between the two and which other factors affect and improve predictability of team performance using salaries. Our analysis starts with simple linear regression between the two and its dynamic in time, and proceeds by building more complex models based on players’ impact and role. While such approach may seem illusive due to unavailability of players data before season begins its feasibility is based on of the assumption that every team expects certain performance and impact from the players.
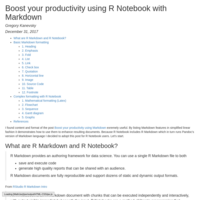
Boost your productivity using R Notebook with Markdown
I found post Boost your productivity using Markdown content and format exremely useful. It examplifies Markdown features that enhance resulting documents in simple linear fashion. And because R Notebook is based on (or includes) R Markdown which in turn is a version of Markdown language I decided to adopt this post for R Notebook.
Data Science Pipelines with R and Aster with Examples (PARTNERS 2017)
Presentation on data science pipelines with R includes discussion of the use cases and examples which include data manipulation similar to dplyr or h2o, summarization techniques, complex in-database computations and execution, in-database principal component analysis (PCA) and logistic regression with R and SQL-MR, and more. Scalable data science with Teradata Aster analytical platform and R culminates with design, development, and deployment of data science pipelines. Source code is available on github: https://github.com/grigory93/r-notebooks/blob/master/demo3-survival-analysis.Rmd
Customer Segmentation Use Case: K-Means with R and Teradata Aster
github: https://github.com/grigory93/r-notebooks/blob/master/demo3-kmeans.Rmd
Customer segmentation problem serves as a foundation for many applications of machine learning in business use cases. In this article we demonstrate k-means-based segmentation of imaginary mobile service provider's customer base by their service usage metrics such as voice, text, and data.
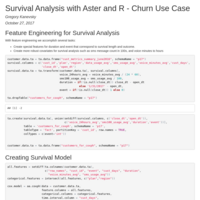
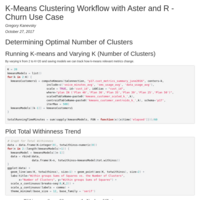
Churn Use Case: Survival Analysis with R and Teradata Aster
github: https://github.com/grigory93/r-notebooks/blob/master/demo3-survival-analysis.Rmd
Churn use case receives constant attention as one of top data mining and machine learning exercises due its business value and pervasiveness across industries. Survival analysis applicability to customer churn is long known. In this article we demonstrate how imaginary mobile service provider can utilize Cox Proportional Hazard model to the customer churn use case.
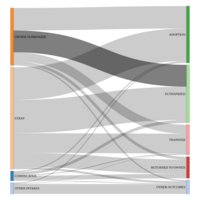
Dogs in Dallas Animal Shelters: Admission to Outcome by Stay Time (Average)
“Helping Dallas be a safe, compassionate, and healthy place for people and animals”.
Dallas Animal Shelter Data pertains to operational processes carried out by shelter personnel who assist citizens by receiving surrendered and stray animals, facilitating adoptions, transferring animals to rescue groups, and providing care to the animals in the shelter every day. Shelter personnel document their work using Chameleon software, an animal shelter management program. The Dallas Animal Shelter Data is updated daily to help citizens better understanding the operational processes that the shelter personnel perform daily for the animals and citizens of the City of Dallas. The start date is October 01, 2014 and through August, 2017.
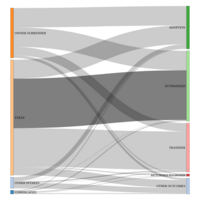
Cats in Dallas Animal Shelters: Admission to Outcome by Stay Time (Average)
Description: “Helping Dallas be a safe, compassionate, and healthy place for people and animals”.
Dallas Animal Shelter Data pertains to operational processes carried out by shelter personnel who assist citizens by receiving surrendered and stray animals, facilitating adoptions, transferring animals to rescue groups, and providing care to the animals in the shelter every day. Shelter personnel document their work using Chameleon software, an animal shelter management program. The Dallas Animal Shelter Data is updated daily to help citizens better understanding the operational processes that the shelter personnel perform daily for the animals and citizens of the City of Dallas. The start date is October 01, 2014 and through August, 2017
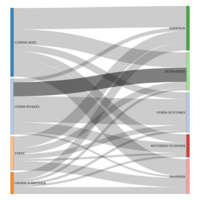
Dogs in Dallas Animal Shelters: Admission to Outcome by Volume
“Helping Dallas be a safe, compassionate, and healthy place for people and animals”.
Dallas Animal Shelter Data pertains to operational processes carried out by shelter personnel who assist citizens by receiving surrendered and stray animals, facilitating adoptions, transferring animals to rescue groups, and providing care to the animals in the shelter every day. Shelter personnel document their work using Chameleon software, an animal shelter management program. The Dallas Animal Shelter Data is updated daily to help citizens better understanding the operational processes that the shelter personnel perform daily for the animals and citizens of the City of Dallas. The start date is October 01, 2014 and through end of July, 2017
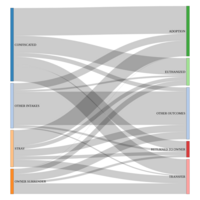
Cats in Dallas Animal Shelters: Admission to Outcome by Volume
“Helping Dallas be a safe, compassionate, and healthy place for people and animals”.
Dallas Animal Shelter Data pertains to operational processes carried out by shelter personnel who assist citizens by receiving surrendered and stray animals, facilitating adoptions, transferring animals to rescue groups, and providing care to the animals in the shelter every day. Shelter personnel document their work using Chameleon software, an animal shelter management program. The Dallas Animal Shelter Data is updated daily to help citizens better understanding the operational processes that the shelter personnel perform daily for the animals and citizens of the City of Dallas. The start date is October 01, 2014 and through end of July, 2017
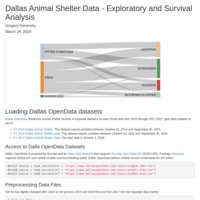
Dallas Animal Services Shelters - Exploratory and Survival Analysis
Dallas OpenDatta Dallas Animal Shelter Data pertains to operational processes carried out by shelter personnel who assist citizens by receiving surrendered and stray animals, facilitating adoptions, transferring animals to rescue groups, and providing care to the animals in the shelter every day. Shelter personnel document their work using Chameleon software, an animal shelter management program. The Dallas Animal Shelter Data is updated daily to help citizens better understanding the operational processes that the shelter personnel perform daily for the animals and citizens of the City of Dallas.
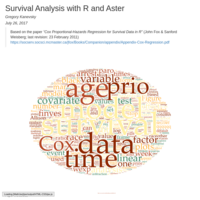
Survival Analysis and Cox PH Regression with R and Aster R
Cox proportional-hazards regression analysis becomes popular method of predicting failure and survival events in variety of business use cases. We discuss the method, its applications, and examples using R and Aster R environments.
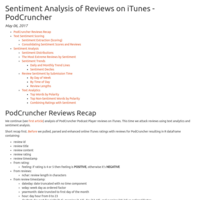
Sentiment Analysis of Reviews on iTunes - PodCruncher
iPhone App developers care the most about its App rankings in App Store. One of main factors contributing to rankings are user ratings. Together with rating user always submits a review that usually describes key points driving rating decision. Found in both iTunes and AppStore App ratings and reviews are rich content for better understanding what drives user satisfaction (or dissatisfaction or both). In this document we continue (see part I http://rpubs.com/grigory/PodCruncher) analysis for popular iPhone podcast player - PodCruncher - using sentiment extracted from 500 reviews and applying different methods and visualizations.
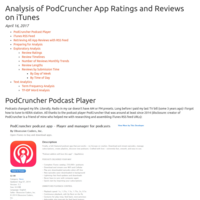
Analysis of PodCruncher App Ratings and Reviews in iTunes
iPhone App developers care the most about its App rankings in App Store. One of main factors contributing to rankings are user ratings. Together with rating user always submits a review that usually describes key points driving rating decision. Found in both iTunes and AppStore App ratings and reviews are rich content for better understanding what drives user satisfaction (or dissatisfaction or both). In this document we analyze ratings and reviews for popular iPhone podcast player - PodCruncher - and illustrate how lack of new releases affects its user base.

Data Science Pipeline with Teradata Aster R
Scalable data science with Teradata Aster analytical platform and Aster R to design, develop, and deploy data science pipelines at scale and across enterprise data sources.
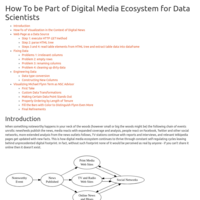
How To Be Part of Digital Media Ecosystem for Data Scientists
Simple illustration of how data scientist can contribute to, enhance, and compliment digital news content in simple but complete example that illustrates practical but realistic workflow of a news flowing into data that becomes a visualization that contributes back to a story again.
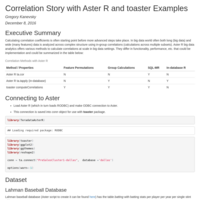
Correlations on big data with Aster R, in-database R, and toaster
Simple goal of computing correlations on large data sets may be a daunting task in R. Having Aster database do the job is simple with Aster R but there is no single way to get the job done. With examples using Aster R, in-database R, and toaster we demonstrate advantages of each. The least, the examples shown provide reader with better understanding of how Aster R addresses analytics with big data.
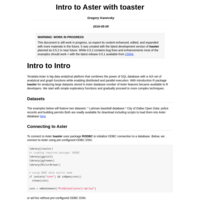
Intro to Aster with toaster
Extensive set of examples and tips on how to work with Teradata Aster big data platform using R and package toaster.
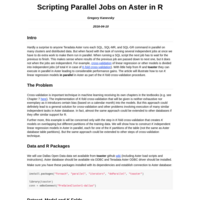
Scripting Parallel Jobs on Aster in R
Hardly a surprise to anyone Teradata Aster runs each SQL, SQL-MR, and SQL-GR command in parallel on many clusters and across distributed data. But when faced with the task of running several independent jobs at once we have to do extra work to parallelize them in Aster. For example, cross-validation of linear regression or other models is divided into independent jobs each working with its respective partition. These jobs could run in parallel in Aster with little help from R. This article will illustrate how to run K linear regression models in parallel in Aster as part of the K-fold cross-validation procedure.
Graphs with Aster and toaster
The Aster graph functions use the Aster Database SQL-GR framework, which allows large-scale graph analysis in-database. While these functions offer wide range of specialized graph analysis their integration and visualization is beyond of the scope of the Aster database. At the same time few of competing graph products, such as neo4j, offer both. toaster attempts to fill this gap by offering comprehensive graph functionality that expands and integrates Aster functions. It also exposes Aster graph data inside R as network (graph) objects and expand set of graph functionality. As always, toaster does this by taking advantage of Aster in-database performance, scalability and distributed architecture.
Kmeans with toaster package
K-means clustering is powerful unsupervised learning technique available out of the box with Aster database. But it still requires certain amount of data preparation, handling, and custom coding to acheive the same results as with core R functions kmeans, scale, etc. toaster streamlines and simplifies kmeans clustering with Aster with its family of kmeans clustering functions for computing and vizualization.