heruwiryanto
Heru Wiryanto
Recently Published
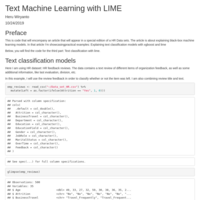
HR Predictive Analytics :Text Analysis Machine Learning with Lime in R
This is code that will explain an article that will appear in a special edition of a Using Hr Data sets for HR Predictive Analytics. The article is about explaining black-box machine learning models. In that article I’m showcasing practical examples: Explaining text classification of employee attrition model with xgboost and lime
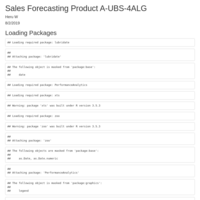
Machine learning for Sales prediction UBS prod A
time series analysis with ML
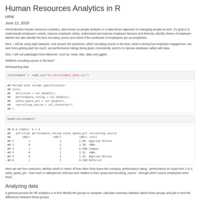
EDA - HR Analytics
example
APIO practicum 1
practicum case study 1
Document
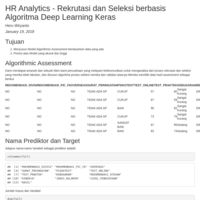
Implementasi Keras Deep learning pada Algoritmik Assessment
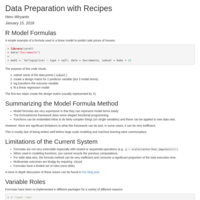
Data Preparation with Recipes
R has an excellent framework for specifying models using formulas. While elegant and useful, it was designed in a time when models had small numbers of terms and complex preprocessing of data was not commonplace. As such, it has some limitations. In this talk, a new package called recipes is shown where the specification of model terms and preprocessing steps can be enumerated sequentially. The recipe can be estimated and applied to any dataset. Current options include simple transformations (log, Box-Cox, interactions, dummy variables, …), signal extraction (PCA, ICA, MDS), basis functions (splines, polynomials), imputation methods, and others.
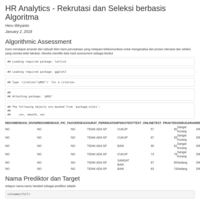
Algoritmik Assessment - Analytics dalam Rekrutasi dan Seleksi
Penjelasan mengenai proses bagaimana menyiapkan data, menyusun model, melakukan pembuktian validasi model, dan melakukan prediksi ke depan,
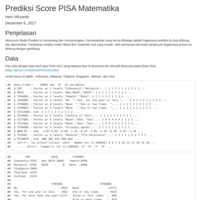
Prediksi Skore Matematika PISA
Mengembangkan model untuk negara : Indonesia, Malaysia, Singapura, Thailand, Vietnam, dan Cina
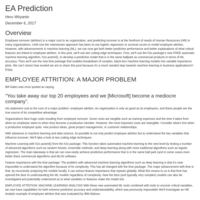
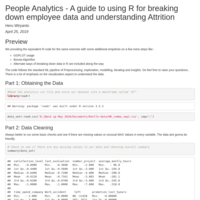
Predicting employee attrition - Who will quit & when?
Predicted risk scores for an employee, can help Recruitment teams to have suitable replacements on time and also prevent revenue leakage.
Who will quit and when—the burning topic of every office’s grapevine! Irrespective of our nature of job, industry that we work for, the levels we work at, we all tend to contribute to this discussion with limited insight of the issue. Well, why do employees leave the organization? The reasons could be salary, health issue, career growth, work location, or motivation. These reasons may vary from organization to organization and from employee to employee. Now, the questions here are, Can attrition be prevented? How can one gauge the signs of flight risk long before a high performer starts looking for a new position? Is there a trend, any symptoms? The answer is YES. Diving deeper into the issue indicates that the employee-organization disconnect is not an overnight phenomenon. It starts long before an employee decides to quit. A systematic analysis of the same will definitely throw light on unforeseen factors enabling you to predict attrition. The ability to predict – Which employee will quit the organization, will help organizations in developing and improving retention strategies.
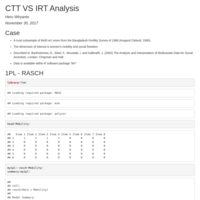
CTT vs IRT 3PL
Menggambarkan perbedaan yang kontras hasil perhitungan estimasi abilitas dengan IRT 3 PL untuk total skore sama maka nilai theta (ability) yang berbeda, yang menarik untuk IRT 1PL atau Rasch ternyata nilai thetanya tidak berbeda untuk total skore yang sama.
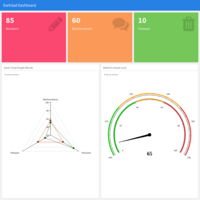
D3ad Dashboard
dashboarding for d3ad test
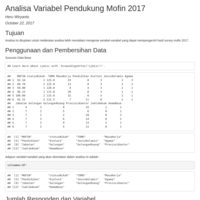
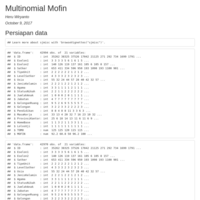
Mofin2017
Analisa lebih lanjut
Mofin Multinom
Mofin Multinom
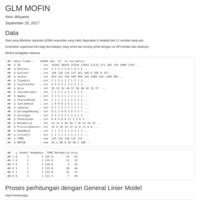
GLM Mofin 2017 Final
Final
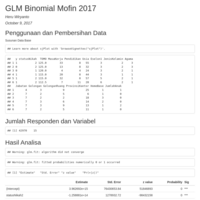
Binomial-Mofin-2017
Mofin Binomial 2017
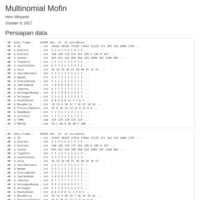
MF Multinom
MF Multinom
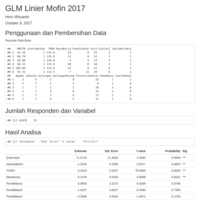
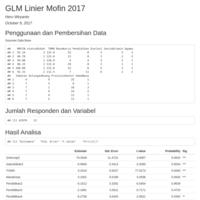
MF2017 - GLM - Linier
GLM - Linier
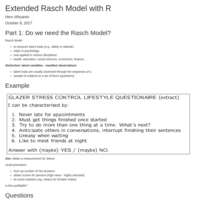
Extended Rasch Model with R
Rost (1999) claimed in his article that “even though the Rasch model has been existing for such a long time, 95% of the current tests in psychology are still constructed by using methods from classical test theory” (p. 140). Basically, he quotes the following reasons why the Rasch model (rm) is being rarely used: The Rasch model in its original form (Rasch 1960), which
was limited to dichotomous items, is arguably too restrictive for practical testing purposes.
Thus, researchers should focus on extended Rasch models. In addition, Rost argues that there is a lack of user-friendly software for the computation of such models. Hence, there is a need for a comprehensive, user-friendly software package. Corresponding recent discussions can be found in Kubinger (2005) and Borsboom (2006). In addition to the basic rm, the models that can be computed with eRm package are: the linear logistic test model (Scheiblechner 1972), the rating scale model (Andrich 1978), the linear rating scale model (Fischer and Parzer 1991), the partial credit model (Masters 1982), and the linear partial credit model (Glas and Verhelst 1989; Fischer and Ponocny 1994). These models and their main characteristics are presented in Section 2. A more recent addition to eRm has been the linear logistic models with relaxed assumptions (Fischer 1995b; Fischer
and Ponocny 1995) that provides a very flexible framework with a wide range of applications.
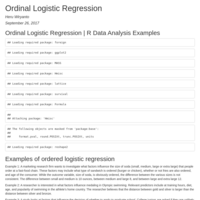
Ordinal Logistic Regression
Ordinall logistic regression is used to model Ordinal outcome variables, in which the log odds of the outcomes are modeled as a linear combination of the predictor variables.
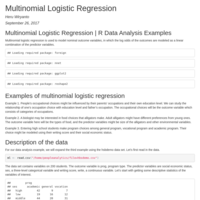
Multinomial Logistic Regression
Multinomial logistic regression is used to model nominal outcome variables, in which the log odds of the outcomes are modeled as a linear combination of the predictor variables.
Plotting GLM
plotting glm
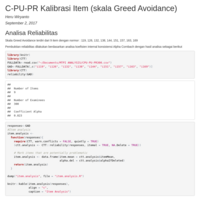
Analisa CTT untuk skala Greed Avoidance C-PUPR
Analisa Reliabilitas dan konfirmatori analisa faktor untuk 9 item.
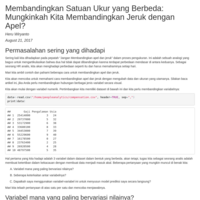
satuan ukur
membandingkan satuan ukur berbeda
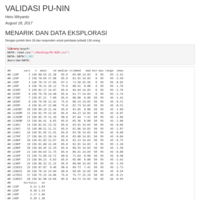
Validasi angket 28 item
project validasi 28 item likert dengan teori klasik
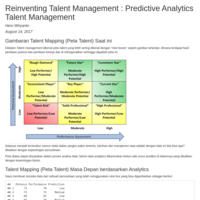
Reinventing Talent Management with Predictive Analytics Approach
Transformasi dari nine boxes grid approach ke talent analytics approach
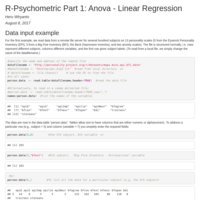
Part 1 R : Anova - Linear Regression
Anova and Linear Regression
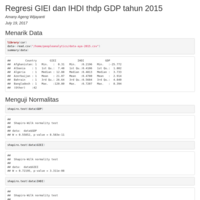
GDP-GIEI-IHDI-2015
kerjaan aya
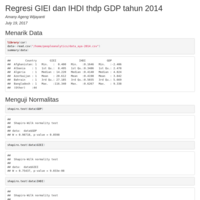
GDP-GIEI-IHDI-2014
Kerjaan Aya
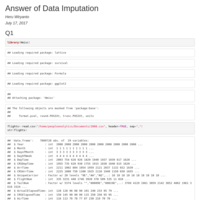
Answer of Data Imputation Exercise
Answer of Data Imputation Exercise
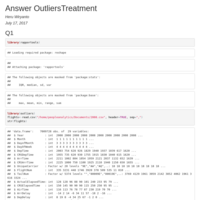
Outliers Treatment
Answer of exercise data mining workshop
Prediksi N1725
Tugas prediksi
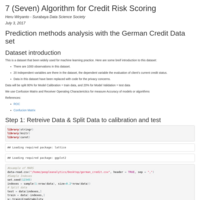
7 Machine Learning (algorithms) of Credit Scoring
As Machine Learning tools become mainstream, and ever-growing choice of these is available to data scientists and analysts, the need to assess those best suited becomes challenging. In this study, 7 Machine Learning models were benchmarked for their accuracy and speed performance on a multi-core hardware, when applied to german credit datasets.
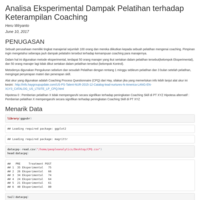
Analisa Eksperimental Dampak Pelatihan terhadap keterampilan Coaching
Dilakukan disebuah perusahaan X yang memeberikan penugasan bagaimana cara melihat dapmpak dari sebuah pelatihan/
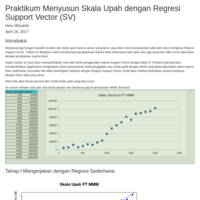
Menyusun Skala Upah dengan Regresi SV
Dalam tulisan ini saya akan memperlihatkan cara dan teknik penggunaan regresi Support Vector dengan basis R. Pertama kali kita akan memperlihatkan bagaimana mengerjakan kasus penyusunan skala penggajian atau skala upah dengan teknik yang biasa digunakan yakni regresi linier sederhana, kemudian kita akan bandingkan hasilnya dengan Regresi Support Vector, Anda akan melihat perbedaan antara keduanya dengan basis data yang sama.
LAVAAN-SEM
SEM berbasis Lavaan
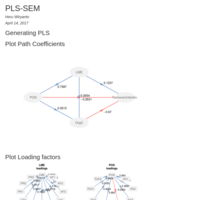
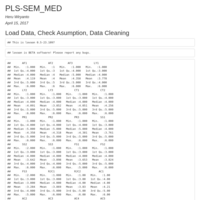
PLS-SEM
Mencoba PLS -SEM
Accounts Receivables Analytics with Meaningfull Machine Learning
Tulisan ini menyajikan kode dan rumus yang digunakan untuk menghasilkan analisis contoh dan pokok-pokok yang ditampilkan dalam studi kasus saya mengenai membangun model pembelajaran mesin yang bermakna (Meaningful Machine Learning) untuk memprediksi kolektibilitas piutang (AR).
Melalui kajian ini diharapkan didapatkan satu algoritma yang presisinya cukup untuk melakukan prediksi sebuah account akan bermasalah di kemudian hari dan faktor faktor apa saja yang mempengaruhinya, sehingga Chief Financial Officer mampu menciptakan insight dan tindakan yang proaktif dalam menanggulangi permasalahan piutang ini dikemudian hari.
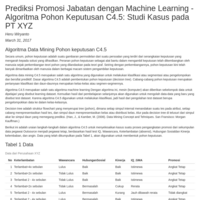
Prediksi Promosi Jabatan dengan Machine Learning - Algoritma Pohon Keputusan C4.5
Pada kajian ini disimulasikan bagaimana cara mengembangkan dan melakukan validasi algoritma sistem promosi pengangkatan pegawai melalui diagram pohon. Algoritma ini selanjutnya dapat dijadikan acuan dalam proses pengambilan keputusan secara obyektif, cepat, efisien dan efektif.
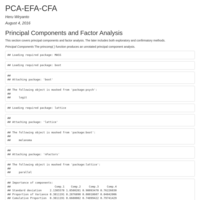
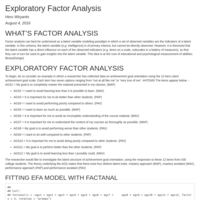
Advanced Exploratory Factor Analysis
isusun untuk menjawab peserta workshop

Compensation Analytics
Penyusunan Struktur Gaji dengan 2 variabel
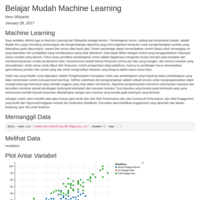
Easy_ML
belajar Mudah Machine Learning
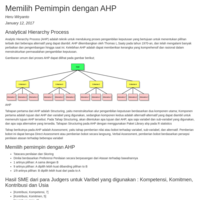
Memilih Pemimpin dengan teknik AHP
Penjelasan bagaimana menerapkan teknik Analytical Hierarchy Process untuk memilih pemimpin dengan variabel : Kompetensi, komitmen, Kontribusi dan Usia.
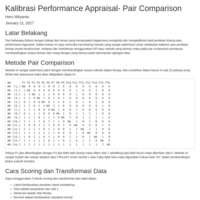
Kalibrasi Penilaian Kinerja dengan Metode Pair Comparison
Dalam hal ini menjelaskan bagaimana melakukan kalibrasi terhadap hasil penilain kinerja kemudian mencari model pengukuran yang cocok untuk data tersebut.
Baroqoloh u fee kum
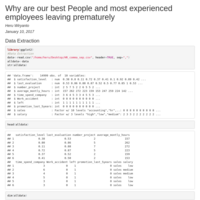
Why are our best People and most experienced employees leaving prematurely
Case Study : People Analytics. Descriptive - Predictive Analytics
Predictor : Left Employee Features : Satisfaction level, last evaluation result, number project, average monthly hours, time spend company, Work accident, promotion last 5 years, division , salary level.
2PLTryout
Try out 2 PL
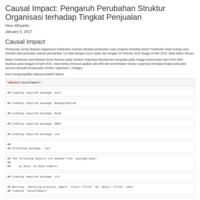
Analisa dampak perubahan struktur Organisasi di divisi penjualan terhadap tingkat Penjualan
Analisa dampak perubahan struktur Organisasi di divisi penjualan terhadap tingkat Penjualan dengan metode Causal impact
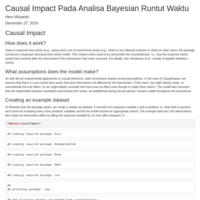
Causal Impact
Causal Impact by Google
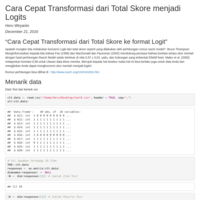
Cara Cepat ransformasi dari Total Skore menjadi Logits
Metode cepat merubah dari Total Skore ke Logits
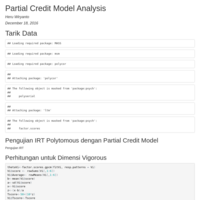
Partial Credit Model
Analisa angket model rating scale dengan PCM. Hasilnya menarik korelasi antara CTT dengan PCM pada tinggi diatas 0.75 secara linier.
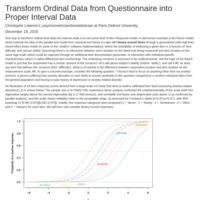
Transform Ordinal Data from Questionnaire into Proper Interval Data
Explanation about methodology for Transforming Ordinal Data from Questionnaire into Proper Interval Data.
Document
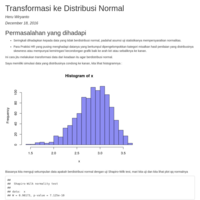
Transformasi Data ke Distribusi Normal
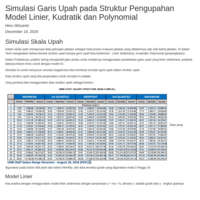
Simulasi Struktur Upah
Dalam skala upah mempunyai data golongan jabatan sebagai hasil proses evaluasi jabatan yang didalamnya ada nilai bobot jabatan. Di dalam Teori mengatakan bahwa bentuk struktur upah berupa garis upah bisa berbentuk : Linier Sederhana, Kuadratik, Polynomial (perpangkatan). Simulasi ini memodelkan beberapa model diatas
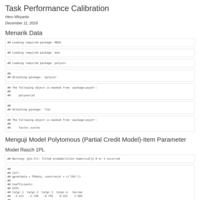
Kalibrasi Task Performance
Ini adalah hasil perhitungan dan kalibrasi 7 item Task Performance dari IPWQ dengan menggunakan responden sebanyak 503 Responden
Polytomous simulasi
coba
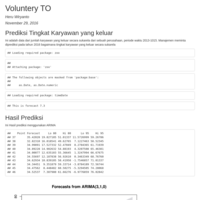
Studi Kasus Prediksi data HR
Ini simulasi prediksi data HR atas total employee, biaya overtime, biaya salary, dan total employee yang resign.

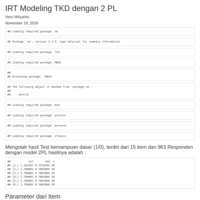
Model Test kemampuan Dasar Dengan 2 PL
Ini mencoba 2 PL untuk data TKD

Prediksi Jumlah Tenaga Kerja
Ini jawaban dari studi kasus
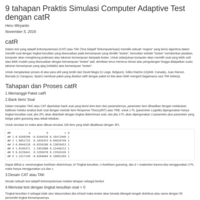
9 tahapan praktis Simulasi CAT dengan catR
Menerangkan bagaimana caranya algortima catR bekerja, secara efektif.
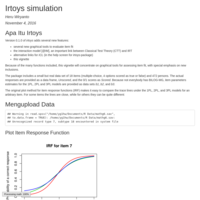
Irtoys
trying using Irtoys
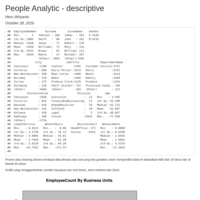
People Analytics - Descriptive
Ini ilustrasi penggunaan statistika deskriptif dalam people analytics
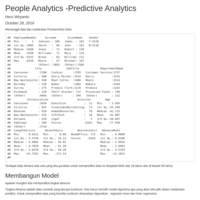
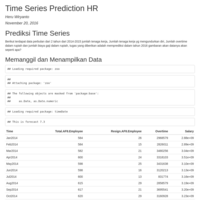
People Analytics - Predictive
Ilustrasi penggunaan Predictive Analytics di bidang people management, dalam hal ini di ilustrasikan memprediksi tingkat absensi di sebuah perusahaan.

CFA MTPI
Hasil analisa MTPI
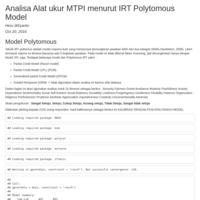
Validasi MTPI dimensi tahap 1
Projek validasi MTPI dengan Item Response Theory model polytokous
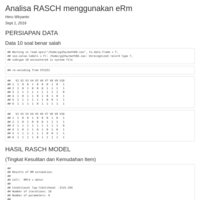
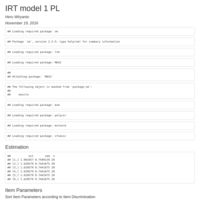
Rasch dengan eRm
Penjelasan analisa rasch dengan paket eRm pada R.
Publish Document
Ini hasil kalibrasi test logika verbal 50 soal multiple choice, 3 alternatif jawaban, diuji dengan Rasch model, IRT 1 PL, 2Pl, dan 3PL dilihat dari uji modelnya cocok digunakan rasch model.
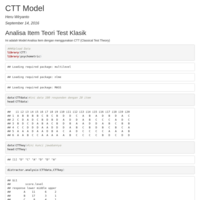
Analisa Item Teori Test Klasik (CTT)
Ini analisa item dengan menggunakan teori test klasik dengan library : CTT dan library: Psychometric
Filenya PAk Winny
Ini percobaan dari pak Winny
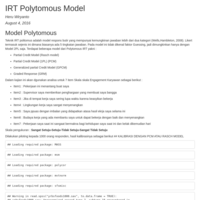
IRT POLYTOMOUS
INI PROSESNYA
EFA II
EFA sessi II
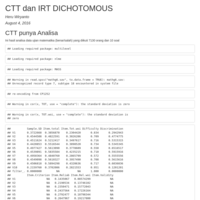
CTT - IRT JOGJA
Ini sessi CTT - IRT RASCH-1PL-2PL-3PL

Pengenalan Lingkungan R
Bahan ini mengenalkan peserta untuk mengenal lingkungan R

Berkenalan dengan R
dicoba