
igukusamuel
Samuel Kigamba
Recently Published
DATA 605 Final Project - Presentation
DATA 605 Final Exam - Presentation
DATA 605 Final Project
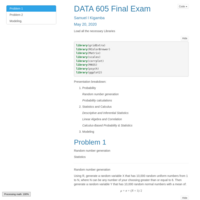
Final Exam
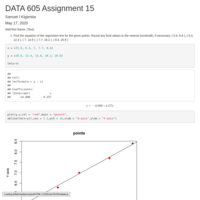
DATA 605 Assignment 15
Multivariate Calculus
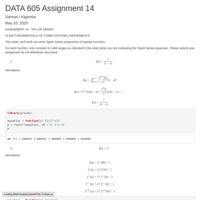
DATA 605 Assignment 14
ASSIGNMENT 14 - TAYLOR SERIES
IS 605 FUNDAMENTALS OF COMPUTATIONAL MATHEMATICS
This week, we’ll work out some Taylor Series expansions of popular functions.
For each function, only consider its valid ranges as indicated in the notes when you are
computing the Taylor Series expansion. Please submit your assignment as a R-Markdown
document.
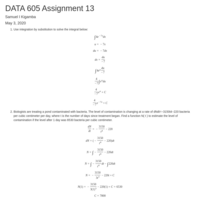
DATA 605 Assignment 13
Calculus
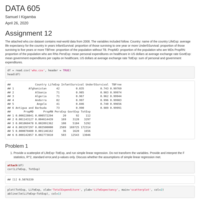
DATA 605 Assignment 12
The attached who.csv dataset contains real-world data from 2008. The variables included follow. Country: name of the country LifeExp: average life expectancy for the country in years InfantSurvival: proportion of those surviving to one year or more Under5Survival: proportion of those surviving to five years or more TBFree: proportion of the population without TB. PropMD: proportion of the population who are MDs PropRN: proportion of the population who are RNs PersExp: mean personal expenditures on healthcare in US dollars at average exchange rate GovtExp: mean government expenditures per capita on healthcare, US dollars at average exchange rate TotExp: sum of personal and government expenditures.
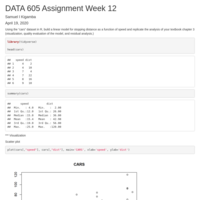
DATA 605 Assignment 11
Using the “cars” dataset in R, build a linear model for stopping distance as a function of speed and
replicate the analysis of your textbook chapter 3 (visualization, quality evaluation of the model, and
residual analysis.)
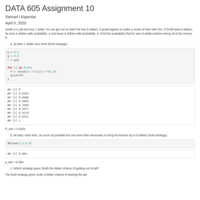
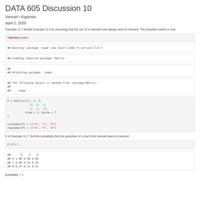
DATA 605 Assignment 10
Smith is in jail and has 1 dollar; he can get out on bail if he has 8 dollars. A guard agrees to make a series of bets with him. If Smith bets A dollars, he wins A dollars with probability .4 and loses A dollars with probability .6. Find the probability that he wins 8 dollars before losing all of his money if:
a. he bets 1 dollar each time (timid strategy).
b. he bets, each time, as much as possible but not more than necessary to bring his fortune up to 8 dollars (bold strategy).
c. Which strategy gives Smith the better chance of getting out of jail?
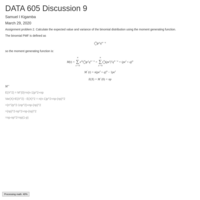
DATA 605 Discussion 9
Assignment problem 2.
Calculate the expected value and variance of the binomial distribution using the moment
generating function.
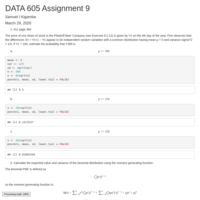
DATA 605 Assignment 9
1. #11 page 363
2. Calculate the expected value and variance of the binomial distribution using the moment generating function.
3. Calculate the expected value and variance of the exponential distribution using the moment generating function.
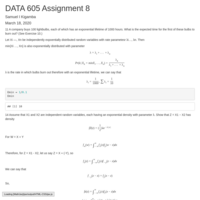
DATA 605 Assignment 8
DATA 605 Assignment 8
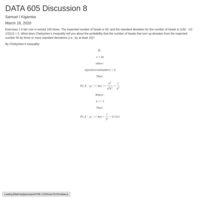
DATA 605 Discussion 8
Exercises 1 A fair coin is tossed 100 times. The expected number of heads is 50, and the standard deviation for the number of heads is (100 · 1/2 · 1/2)1/2 = 5. What does Chebyshev’s Inequality tell you about the probability that the number of heads that turn up deviates from the expected number 50 by three or more standard deviations (i.e., by at least 15)?
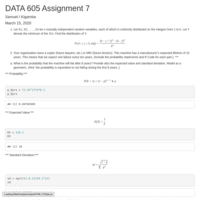
DATA 605 Assignment 7
DATA 605 Assignment 7
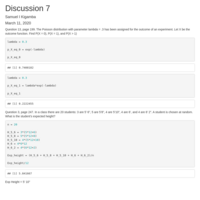
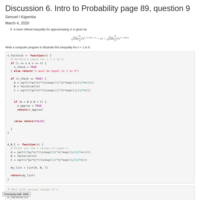
DATA 605 Discussion 6
Intro to Probability page 89, question 9
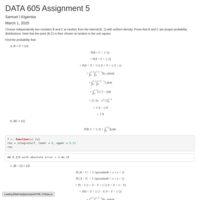
DATA 605 Assignment5
Choose independently two numbers B and C at random from the interval [0, 1] with
uniform density. Prove that B and C are proper probability distributions.
Note that the point (B,C) is then chosen at random in the unit square.
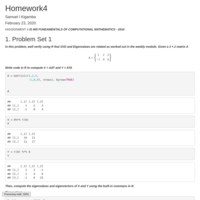
DATA 605 Assignment4
ASSIGNMENT 4
IS 605 FUNDAMENTALS OF COMPUTATIONAL MATHEMATICS - 2014
DATA 605 Assignment3
Rank of a Matrix and Eigenvalues and Eigenvectors computations
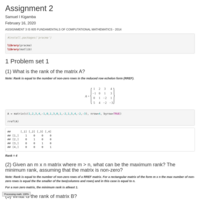
DATA 605 Assignment2
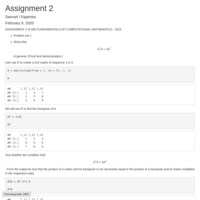
ASSIGNMENT 2
IS 605 FUNDAMENTALS OF COMPUTATIONAL MATHEMATICS - 2015
1. Problem set 1
(1) Show that AT A 6= AAT
in general. (Proof and demonstration.)
(2) For a special type of square matrix A, we get AT A = AAT
. Under what conditions
could this be true? (Hint: The Identity matrix I is an example of such a matrix).
Please typeset your response using LaTeX mode in RStudio. If you do it in paper, please
either scan or take a picture of the work and submit it. Please ensure that your image is
legible and that your submissions are named using your first initial, last name, assignment
and problem set within the assignment. E.g. LFulton_Assignment2_PS1.png
2. Problem set 2
Matrix factorization is a very important problem. There are supercomputers built just
to do matrix factorizations. Every second you are on an airplane, matrices are being
factorized. Radars that track flights use a technique called Kalman filtering. At the heart
of Kalman Filtering is a Matrix Factorization operation. Kalman Filters are solving linear
systems of equations when they track your flight using radars.
Write an R function to factorize a square matrix A into LU or LDU, whichever you
prefer. Please submit your response in an R Markdown document using our class naming
convention, E.g. LFulton_Assignment2_PS2.png
You don’t have to worry about permuting rows of A and you can assume that A is less
than 5x5, if you need to hard-code any variables in your code. If you doing the entire
assignment in R, then please submit only one markdown document for both the problems.
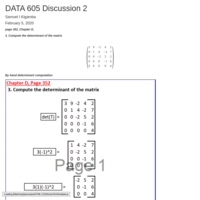
DATA 605 Discussion 2
Compute the determinant of the matrix
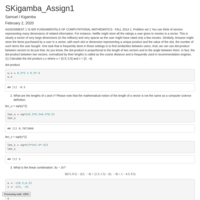
DATA 605 Assignment1
ASSIGNMENT 1
IS 605 FUNDAMENTALS OF COMPUTATIONAL MATHEMATICS - FALL 2014
1. Problem set 1
You can think of vectors representing many dimensions of related information. For
instance, Netflix might store all the ratings a user gives to movies in a vector. This is
clearly a vector of very large dimensions (in the millions) and very sparse as the user might
have rated only a few movies. Similarly, Amazon might store the items purchased by a user
in a vector, with each slot or dimension representing a unique product and the value of the
slot, the number of such items the user bought. One task that is frequently done in these
settings is to find similarities between users. And, we can use dot-product between vectors
to do just that. As you know, the dot-product is proportional to the length of two vectors
and to the angle between them. In fact, the dot-product between two vectors, normalized
by their lengths is called as the cosine distance and is frequently used in recommendation
engines.
(1) Calculate the dot product u.v where u = [0.5; 0.5] and v = [3; −4]
(2) What are the lengths of u and v? Please note that the mathematical notion of the
length of a vector is not the same as a computer science definition.
(3) What is the linear combination: 3u − 2v?
(4) What is the angle between u and v
You can use R-markdown to submit your responses to this problem set. If you decide to
do it in paper, then please either scan it or take a picture using a smartphone and attach
that picture. Please make sure that the picture is legible before submitting.
2. Problem set 2
Set up a system of equations with 3 variables and 3 constraints and solve for x. Please
write a function in R that will take two variables (matrix A & constraint vector b) and
solve using elimination. Your function should produce the right answer for the system of
equations for any 3-variable, 3-equation system. You don’t have to worry about degenerate
cases and can safely assume that the function will only be tested with a system of equations
that has a solution. Please note that you do have to worry about zero pivots, though. Please
note that you should not use the built-in function solve to solve this system or use matrix
inverses. The approach that you should employ is to construct an Upper Triangular Matrix
and then back-substitute to get the solution. Alternatively, you can augment the matrix
A with vector b and jointly apply the Gauss Jordan elimination procedure.
1
2 IS 605 FUNDAMENTALS OF COMPUTATIONAL MATHEMATICS - FALL 2014
Please test it with the system below and it should produce a solution x = [−1.55, −0.32, 0.95]
1 1 3
2 −1 5
−1 −2 4
x1
x2
x3
=
1
2
6
(1)
Please send your code (as an R-markdown file, named using your first initial, last name,
assignment, problem set. For instance, if I submit the code for this assignment, it will be
called GIyengar Assign1.Rmd
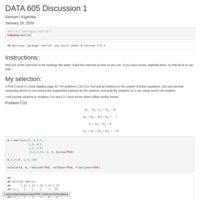
DATA 605 Discussion 1
## Instructions:
Pick one of the exercises in the readings this week. Solve the exercise as best as you can.
If you have issues, explicate them, so that all of us can help.
## My selection:
A First Course in Linear Algebra page 42.
For problems C10-C19, find and all solutions to the system of linear equations. Use your favorite
computing device to row-reduce the augmented matrices for the systems, and write the
solutions as a set, using correct set notation.
I will provide solutions to Problem C10 and C17 since all the others follow similar format.


DATA 606 Class Presentation
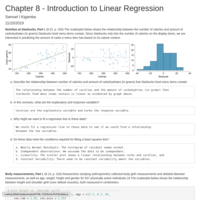
8.31 Body measurements, Part IV.
The scatterplot and least squares summary below show the relationship between weight measured in kilograms and height measured in centimeters of 507 physically active individuals
DATA 607 Assignment 12
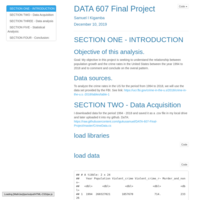
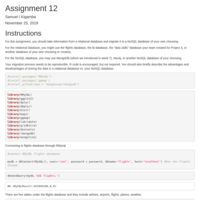
Instructions
For this assignment, you should take information from a relational database and migrate it to a NoSQL database of your own choosing.
For the relational database, you might use the flights database, the tb database, the “data skills” database your team created for Project 3, or another database of your own choosing or creation.
For the NoSQL database, you may use MongoDB (which we introduced in week 7), Neo4j, or another NoSQL database of your choosing.
Your migration process needs to be reproducible. R code is encouraged, but not required. You should also briefly describe the advantages and disadvantages of storing the data in a relational database vs. your NoSQL database.
DATA 606 Lab 9
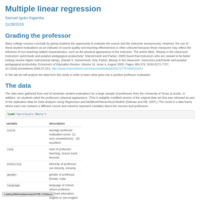
Multiple linear regression
DATA 606 Homework 9
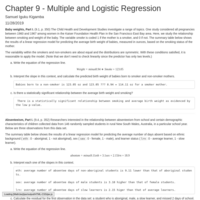
Chapter 9 - Multiple and Logistic Regression
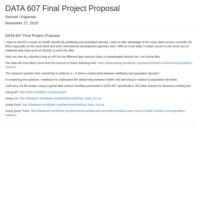
DATA 607 Final Project Proposal
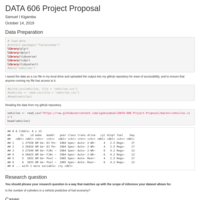
Please start by carefully reading through the requirements in the “MSDA 607 Final Project” document, which can be found in your Week 11 folder.
Your proposal should describe at a high level what you’re seeking to accomplish, and your motivation for performing this analysis. You should describe where you believe you'll find your source data. One paragraph of text that addresses these issues will be sufficient.
If you are going to work in a small group (encouraged!), you should also list your partners’ names. We’ll treat this as a planning document, not a blue print containing “firm, fixed requirements.”
The week after proposals are due, I’ll schedule short meetings with each person (or group) to go through your data sources, plan for doing the work, concerns, etc. I’d encourage you to sketch out these thoughts in your proposal as well, but it is not required in your proposal deliverable.
Your final project proposal can be short: a well-thought out paragraph may be sufficient.
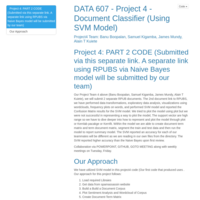
Project 4 DATA 607 B
Team Project Members: Banu Boopalan, Samuel Kigamba, James Mundy, Alain T Kuiete
It can be useful to be able to classify new "test" documents using already classified "training" documents. A common example is using a corpus of labeled spam and ham (non-spam) e-mails to predict whether or not a new document is spam. For this project, you can start with a spam/ham dataset, then predict the class of new documents (either withheld from the training dataset or from another source such as your own spam folder). One example corpus: https://spamassassin.apache.org/old/publiccorpus/ Here are two short videos that you may find helpful. The first video shows how to unzip the provided files. https://youtu.be/6IzhRaSePKU The second video provides a short overview of predictive classifiers. https://youtu.be/5ikDo4SrLNQ For more adventurous students, you are welcome (encouraged!) to come up with a different set of documents (including scraped web pages!?) that have already been classified (e.g. tagged), then analyze these documents to predict how new documents should be classified.
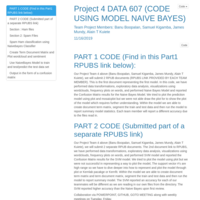
Project 4 DATA 607
Team Project Members: Banu Boopalan, Samuel Kigamba, James Mundy, Alain T Kuiete
It can be useful to be able to classify new "test" documents using already classified "training" documents. A common example is using a corpus of labeled spam and ham (non-spam) e-mails to predict whether or not a new document is spam.
For this project, you can start with a spam/ham dataset, then predict the class of new documents (either withheld from the training dataset or from another source such as your own spam folder). One example corpus: https://spamassassin.apache.org/old/publiccorpus/
Here are two short videos that you may find helpful.
The first video shows how to unzip the provided files.
https://youtu.be/6IzhRaSePKU
The second video provides a short overview of predictive classifiers.
https://youtu.be/5ikDo4SrLNQ
For more adventurous students, you are welcome (encouraged!) to come up with a different set of documents (including scraped web pages!?) that have already been classified (e.g. tagged), then analyze these documents to predict how new documents should be classified.
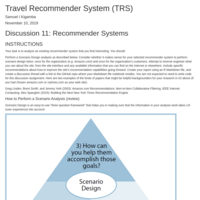
Travel Recommender System (TRS)
###INSTRUCTIONS
Your task is to analyze an existing recommender system that you find interesting. You should:
Perform a Scenario Design analysis as described below. Consider whether it makes sense for your selected recommender system to perform scenario design twice, once for the organization (e.g. Amazon.com) and once for the organization's customers.
Attempt to reverse engineer what you can about the site, from the site interface and any available information that you can find on the Internet or elsewhere.
Include specific recommendations about how to improve the site's recommendation capabilities going forward.
Create your report using an R Markdown file, and create a discussion thread with a link to the GitHub repo where your Markdown file notebook resides. You are not expected to need to write code for this discussion assignment.
Here are two examples of the kinds of papers that might be helpful backgrounders for your research in #2 above (if you had chosen amazon.com or nytimes.com as your web site):
Greg Linden, Brent Smith, and Jeremy York (2003): Amazon.com Recommendations: Item-to-Item Collaborative Filtering, IEEE Internet Computing.
Alex Spangher (2015): Building the Next New York Times Recommendation Engine
####How to Perform a Scenario Analysis (review)
Scenario Design is an easy-to-use “three question framework” that helps you in making sure that the information in your analysis work takes UX (user experience) into account:

Source: “Scenario Design: A Disciplined Approach to Customer Experience,” Bruce D. Temkin, Forrester Research, 2004. Temkin notes that before applying Scenario Design, one might ask, “What functionality should we offer?” After applying Scenario Design, one might instead ask, “What user goals should we serve?”
Your task is to:
Identify a recommender system web site, then
Answer the three scenario design questions for this web site.
This process of guessing/reverse engineering, while inexact, will help you build out your own ability to better account for “user needs” in designing recommender systems going forward. Being able to place the customer first in your mind is a “soft skill” that is highly valued in the technical marketplace.
You may work in a small group on this discussion assignment! Please make your initial post (which includes a link to your GitHub hosted R Markdown file before our meetup on Wednesday, and provide feedback to at least one of your class mates’ posts before end of day on Sunday. Your feedback should include at least one additional reference and/or constructive suggestion.
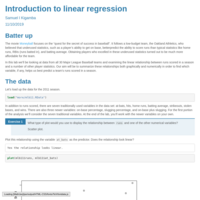
DATA 606 Lab 8
Introduction to linear regression
DATA 606 Homework 8
Chapter 8 - Introduction to Linear Regression
DATA 606 Project Proposal
Project Proposal
The proposal can be more informal using bullet points where necessary and include R code and output. You must address the following areas:
Research question
What are the cases, and how many are there?
Describe the method of data collection.
What type of study is this (observational/experiment)?
Data Source: If you collected the data, state self-collected. If not, provide a citation/link.
Response: What is the response variable, and what type is it (numerical/categorical)?
Explanatory: What is the explanatory variable(s), and what type is it (numerical/categorival)?
Relevant summary statistics
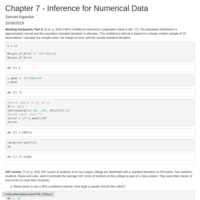
DATA 606 Homework 7
Chapter 7 - Inference for Numerical Data
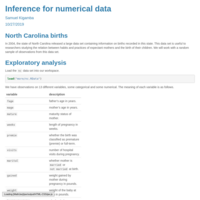
DATA 606 Lab 7
Inference for numerical data
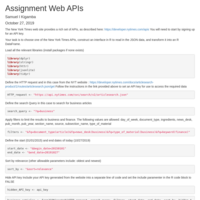
Assignment Web APIs
The New York Times web site provides a rich set of APIs, as described here: https://developer.nytimes.com/apis You will need to start by signing up for an API key.
Your task is to choose one of the New York Times APIs, construct an interface in R to read in the JSON data, and transform it into an R DataFrame.

Project # 3 Presentation - Data Scientists Skills Compared
Project – Data Science Skills This is a project for your entire class section to work on together, since being able to work effectively on a virtual team is a key “soft skill” for data scientists. Please note especially the requirement about making a presentation during our first meetup after the project is due. W. Edwards Deming said, “In God we trust, all others must bring data.” Please use data to answer the question, “Which are the most valued data science skills?” Consider your work as an exploration; there is not necessarily a “right answer.” Grading rubric: You will need to determine what tool(s) you’ll use as a group to effectively collaborate, share code and any project documentation (such as motivation, approach, findings). You will have to determine what data to collect, where the data can be found, and how to load it. The data that you decide to collect should reside in a relational database, in a set of normalized tables. You should perform any needed tidying, transformations, and exploratory data analysis in R. Your deliverable should include all code, results, and documentation of your motivation, approach, and findings. As a group, you should appoint (at least) three people to lead parts of the presentation. While you are strongly encouraged (and will hopefully find it fun) to try out statistics and data models, your grade will not be affected by the statistical analysis and modeling performed (since this is a semester one course on Data Acquisition and Management). Every student must be prepared to explain how the data was collected, loaded, transformed, tidied, and analyzed for outliers, etc. in our Meetup. This is the only way I’ll have to determine that everyone actively participated in the process, so you need to hold yourself responsible for understanding what your class-size team did! If you are unable to attend the meet up, then you need to either present to me one-on-one before the meetup presentation, or post a 3 to 5 minute video (e.g. on YouTube) explaining the process. Individual students will not be responsible for explaining any forays into statistical analysis, modeling, data mining, regression, decision trees, etc. You are encouraged to start early, ask many questions, actively post on the provided discussion forum, etc.
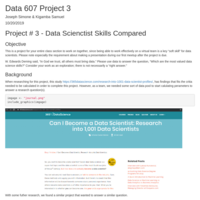
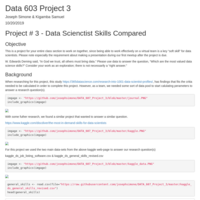
Project # 3 - Data Scienctist Skills Compared
Project – Data Science Skills This is a project for your entire class section to work on together, since being able to work effectively on a virtual team is a key “soft skill” for data scientists. Please note especially the requirement about making a presentation during our first meetup after the project is due. W. Edwards Deming said, “In God we trust, all others must bring data.” Please use data to answer the question, “Which are the most valued data science skills?” Consider your work as an exploration; there is not necessarily a “right answer.” Grading rubric: You will need to determine what tool(s) you’ll use as a group to effectively collaborate, share code and any project documentation (such as motivation, approach, findings). You will have to determine what data to collect, where the data can be found, and how to load it. The data that you decide to collect should reside in a relational database, in a set of normalized tables. You should perform any needed tidying, transformations, and exploratory data analysis in R. Your deliverable should include all code, results, and documentation of your motivation, approach, and findings. As a group, you should appoint (at least) three people to lead parts of the presentation. While you are strongly encouraged (and will hopefully find it fun) to try out statistics and data models, your grade will not be affected by the statistical analysis and modeling performed (since this is a semester one course on Data Acquisition and Management). Every student must be prepared to explain how the data was collected, loaded, transformed, tidied, and analyzed for outliers, etc. in our Meetup. This is the only way I’ll have to determine that everyone actively participated in the process, so you need to hold yourself responsible for understanding what your class-size team did! If you are unable to attend the meet up, then you need to either present to me one-on-one before the meetup presentation, or post a 3 to 5 minute video (e.g. on YouTube) explaining the process. Individual students will not be responsible for explaining any forays into statistical analysis, modeling, data mining, regression, decision trees, etc. You are encouraged to start early, ask many questions, actively post on the provided discussion forum, etc.
Project # 3 - Data Scienctist Skills Compared
Project – Data Science Skills
This is a project for your entire class section to work on together, since being able to work effectively on a virtual team is a
key “soft skill” for data scientists. Please note especially the requirement about making a presentation during our first
meetup after the project is due.
W. Edwards Deming said, “In God we trust, all others must bring data.” Please use data to answer the question,
“Which are the most valued data science skills?” Consider your work as an exploration; there is not necessarily a “right
answer.”
Grading rubric:
You will need to determine what tool(s) you’ll use as a group to effectively collaborate, share code and any
project documentation (such as motivation, approach, findings).
You will have to determine what data to collect, where the data can be found, and how to load it.
The data that you decide to collect should reside in a relational database, in a set of normalized tables.
You should perform any needed tidying, transformations, and exploratory data analysis in R.
Your deliverable should include all code, results, and documentation of your motivation, approach, and findings.
As a group, you should appoint (at least) three people to lead parts of the presentation.
While you are strongly encouraged (and will hopefully find it fun) to try out statistics and data models, your
grade will not be affected by the statistical analysis and modeling performed (since this is a semester one
course on Data Acquisition and Management).
Every student must be prepared to explain how the data was collected, loaded, transformed, tidied, and
analyzed for outliers, etc. in our Meetup. This is the only way I’ll have to determine that everyone actively
participated in the process, so you need to hold yourself responsible for understanding what your class-size
team did! If you are unable to attend the meet up, then you need to either present to me one-on-one before
the meetup presentation, or post a 3 to 5 minute video (e.g. on YouTube) explaining the process. Individual
students will not be responsible for explaining any forays into statistical analysis, modeling, data mining,
regression, decision trees, etc.
You are encouraged to start early, ask many questions, actively post on the provided discussion forum, etc.
DATA 606 Homework 6
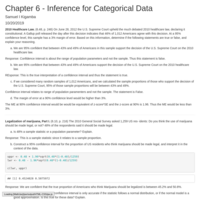
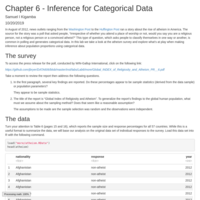
Chapter 6 - Inference for Categorical Data
DATA 606 Lab 6 - Inference for categorical data
Inference for categorical data
DATA 607 Class Presentation
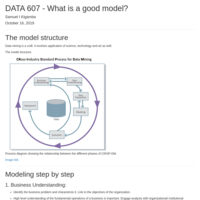
What is a good model?

DATA 606 Project Proposal
---
title: DATA 606 Data Project Proposal
author:
---
```{r echo=FALSE}
# load data
```
### Part 1 - Introduction
### Part 2 - Data
### Part 3 - Exploratory data analysis
### Part 4 - Inference
### Part 5 - Conclusion
### References
### Appendix (optional)
Remove this section if you don't have an appendix
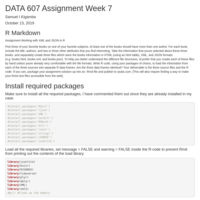
DATA 607 Assignment Week 7
R Markdown
Assignment Working with XML and JSON in R
Pick three of your favorite books on one of your favorite subjects. At least one of the books should have more than one author. For each book, include the title, authors, and two or three other attributes that you find interesting. Take the information that youve selected about these three books, and separately create three files which store the books information in HTML (using an html table), XML, and JSON formats (e.g. “books.html”, “books.xml”, and “books.json”). To help you better understand the different file structures, Id prefer that you create each of these files “by hand” unless youre already very comfortable with the file formats. Write R code, using your packages of choice, to load the information from each of the three sources into separate R data frames. Are the three data frames identical? Your deliverable is the three source files and the R code. If you can, package your assignment solution up into an .Rmd file and publish to rpubs.com. [This will also require finding a way to make your three text files accessible from the web].
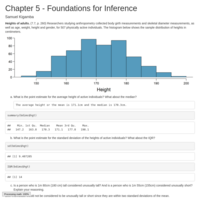
DATA 606 Homework 5
Chapter 5 - Foundations for Inference
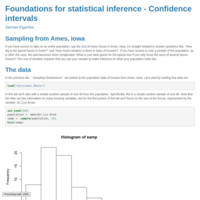
DATA 606 Lab 5b
Foundations for statistical inference - Confidence intervals
Sampling from Ames, Iowa
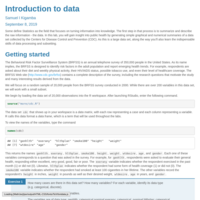
If you have access to data on an entire population, say the size of every house in Ames, Iowa, it’s straight forward to answer questions like, “How big is the typical house in Ames?” and “How much variation is there in sizes of houses?”. If you have access to only a sample of the population, as is often the case, the task becomes more complicated. What is your best guess for the typical size if you only know the sizes of several dozen houses? This sort of situation requires that you use your sample to make inference on what your population looks like.
DATA 606 Lab 5a
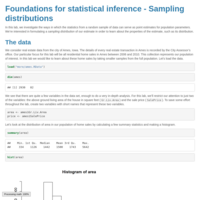
Foundations for statistical inference - Sampling distributions
In this lab, we investigate the ways in which the statistics from a random sample of data can serve as point estimates for population parameters. We’re interested in formulating a sampling distribution of our estimate in order to learn about the properties of the estimate, such as its distribution.
The data
We consider real estate data from the city of Ames, Iowa. The details of every real estate transaction in Ames is recorded by the City Assessor’s office. Our particular focus for this lab will be all residential home sales in Ames between 2006 and 2010. This collection represents our population of interest. In this lab we would like to learn about these home sales by taking smaller samples from the full population. Let’s load the data.
DATA 607 Project 2.1
The goal of this assignment is to give you practice in preparing different datasets for downstream analysis work. Your task is to: (1) Choose any three of the “wide” datasets identified in the Week 5 Discussion items. (You may use your own dataset; please don’t use my Sample Post dataset, since that was used in your Week 6 assignment!) For each of the three chosen datasets: ??? Create a .CSV file (or optionally, a MySQL database!) that includes all of the information included in the dataset. You’re encouraged to use a “wide” structure similar to how the information appears in the discussion item, so that you can practice tidying and transformations as described below. ??? Read the information from your .CSV file into R, and use tidyr and dplyr as needed to tidy and transform your data. [Most of your grade will be based on this step!] ??? Perform the analysis requested in the discussion item. ??? Your code should be in an R Markdown file, posted to rpubs.com, and should include narrative descriptions of your data cleanup work, analysis, and conclusions. (2) Please include in your homework submission, for each of the three chosen datasets: ??? The URL to the .Rmd file in your GitHub repository, and ??? The URL for your rpubs.com web page.
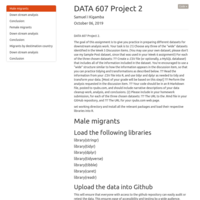
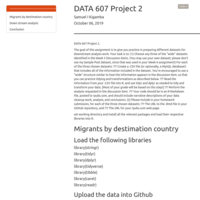
DATA 607 – Project 2
The goal of this assignment is to give you practice in preparing different datasets for downstream
analysis work.
Your task is to:
(1) Choose any three of the “wide” datasets identified in the Week 5 Discussion items. (You may
use your own dataset; please don’t use my Sample Post dataset, since that was used in your
Week 6 assignment!) For each of the three chosen datasets:
Create a .CSV file (or optionally, a MySQL database!) that includes all of the information
included in the dataset. You’re encouraged to use a “wide” structure similar to how the
information appears in the discussion item, so that you can practice tidying and
transformations as described below.
Read the information from your .CSV file into R, and use tidyr and dplyr as needed to
tidy and transform your data. [Most of your grade will be based on this step!]
Perform the analysis requested in the discussion item.
Your code should be in an R Markdown file, posted to rpubs.com, and should include
narrative descriptions of your data cleanup work, analysis, and conclusions.
(2) Please include in your homework submission, for each of the three chosen datasets:
The URL to the .Rmd file in your GitHub repository, and
The URL for your rpubs.com web page.
DATA 606 Assignment 4
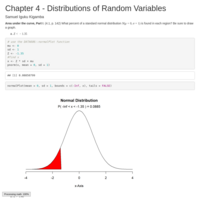
Chapter 4 - Distributions of Random Variables
DATA 606 Lab 4
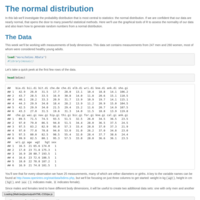
In this lab we'll investigate the probability distribution that is most central
to statistics: the normal distribution. If we are confident that our data are
nearly normal, that opens the door to many powerful statistical methods. Here
we'll use the graphical tools of R to assess the normality of our data and also
learn how to generate random numbers from a normal distribution.
## The Data
This week we'll be working with measurements of body dimensions. This data set
contains measurements from 247 men and 260 women, most of whom were considered
healthy young adults.

DATA 607 Lab 4
In this lab we'll investigate the probability distribution that is most central
to statistics: the normal distribution. If we are confident that our data are
nearly normal, that opens the door to many powerful statistical methods. Here
we'll use the graphical tools of R to assess the normality of our data and also
learn how to generate random numbers from a normal distribution.
## The Data
This week we'll be working with measurements of body dimensions. This data set
contains measurements from 247 men and 260 women, most of whom were considered
healthy young adults.

DATA 607 Assignment 5
The chart above describes arrival delays for two airlines across five destinations. Your task is to:
(1) Create a .CSV file (or optionally, a MySQL database!) that includes all of the information above. You’re encouraged to use a “wide” structure similar to how the information appears above, so that you can practice tidying and transformations as described below.
(2) Read the information from your .CSV file into R, and use tidyr and dplyr as needed to tidy and transform your data.
(3) Perform analysis to compare the arrival delays for the two airlines.
(4) Your code should be in an R Markdown file, posted to rpubs.com, and should include narrative descriptions of your data cleanup work, analysis, and conclusions. Please include in your homework submission:
The URL to the .Rmd file in your GitHub repository. and
The URL for your rpubs.com web page.
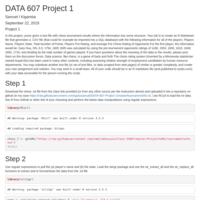
DATA 607 Project 1
Project 1
In this project, you’re given a text file with chess tournament results where the information has some structure. Your
job is to create an R Markdown file that generates a .CSV file (that could for example be imported into a SQL database)
with the following information for all of the players:
Player’s Name, Player’s State, Total Number of Points, Player’s Pre-Rating, and Average Pre Chess Rating of Opponents
For the first player, the information would be:
Gary Hua, ON, 6.0, 1794, 1605
1605 was calculated by using the pre-tournament opponents’ ratings of 1436, 1563, 1600, 1610, 1649, 1663, 1716, and
dividing by the total number of games played.
If you have questions about the meaning of the data or the results, please post them on the discussion forum. Data
science, like chess, is a game of back and forth…
The chess rating system (invented by a Minnesota statistician named Arpad Elo) has been used in many other contexts,
including assessing relative strength of employment candidates by human resource departments.
You may substitute another text file (or set of text files, or data scraped from web pages) of similar or greater
complexity, and create your own assignment and solution. You may work in a small team. All of your code should be in
an R markdown file (and published to rpubs.com); with your data accessible for the person running the script.
DATA 606 Lab 3
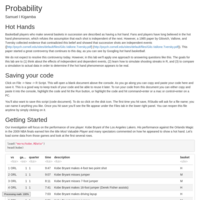
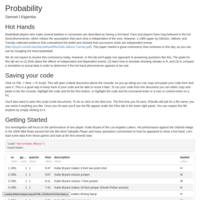
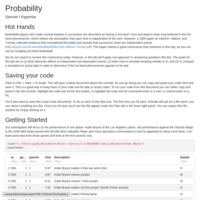
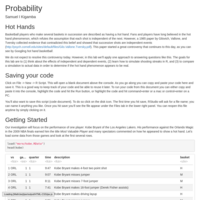
Hot Hands
Basketball players who make several baskets in succession are described as having a hot hand. Fans and players have long believed in the hot hand phenomenon, which refutes the assumption that each shot is independent of the next. However, a 1985 paper by Gilovich, Vallone, and Tversky collected evidence that contradicted this belief and showed that successive shots are independent events (http://psych.cornell.edu/sites/default/files/Gilo.Vallone.Tversky.pdf). This paper started a great controversy that continues to this day, as you can see by Googling hot hand basketball.
We do not expect to resolve this controversy today. However, in this lab we’ll apply one approach to answering questions like this. The goals for this lab are to (1) think about the effects of independent and dependent events, (2) learn how to simulate shooting streaks in R, and (3) to compare a simulation to actual data in order to determine if the hot hand phenomenon appears to be real.
DATA 606 Lab 3
Basketball players who make several baskets in succession are described as having a hot hand. Fans and players have long believed in the hot hand phenomenon, which refutes the assumption that each shot is independent of the next. However, a 1985 paper by Gilovich, Vallone, and Tversky collected evidence that contradicted this belief and showed that successive shots are independent events (http://psych.cornell.edu/sites/default/files/Gilo.Vallone.Tversky.pdf). This paper started a great controversy that continues to this day, as you can see by Googling hot hand basketball.
We do not expect to resolve this controversy today. However, in this lab we’ll apply one approach to answering questions like this. The goals for this lab are to (1) think about the effects of independent and dependent events, (2) learn how to simulate shooting streaks in R, and (3) to compare a simulation to actual data in order to determine if the hot hand phenomenon appears to be real.
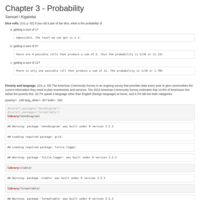
Data 606 Assignment 3
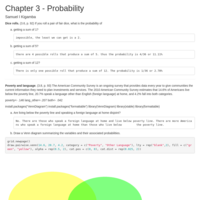
**Dice rolls.** (3.6, p. 92) If you roll a pair of fair dice, what is the probability of
(a) getting a sum of 1?
(b) getting a sum of 5?
(c) getting a sum of 12?
--------------------------------------------------------------------------------
\clearpage
**Poverty and language**. (3.8, p. 93) The American Community Survey is an ongoing survey that provides data every year to give communities the current information they need to plan investments and services. The 2010 American Community Survey estimates that 14.6% of Americans live below the poverty line, 20.7% speak a language other than English (foreign language) at home, and 4.2% fall into both categories.
(a) Are living below the poverty line and speaking a foreign language at home disjoint?
(b) Draw a Venn diagram summarizing the variables and their associated probabilities.
(c) What percent of Americans live below the poverty line and only speak English at home?
(d) What percent of Americans live below the poverty line or speak a foreign language at home?
(e) What percent of Americans live above the poverty line and only speak English at home?
(f) Is the event that someone lives below the poverty line independent of the event that the person speaks a foreign language at home?
--------------------------------------------------------------------------------
\clearpage
**Assortative mating**. (3.18, p. 111) Assortative mating is a nonrandom mating pattern where individuals with similar genotypes and/or phenotypes mate with one another more frequently than what would be expected under a random mating pattern. Researchers studying this topic collected data on eye colors of 204 Scandinavian men and their female partners. The table below summarizes the results. For simplicity, we only include heterosexual relationships in this exercise.
\begin{center}
\begin{tabular}{ll ccc c}
& & \multicolumn{3}{c}{\textit{Partner (female)}} \\
\cline{3-5}
& & Blue & Brown & Green & Total \\
\cline{2-6}
& Blue & 78 & 23 & 13 & 114 \\
\multirow{2}{*}{\textit{Self (male)}} & Brown & 19 & 23 & 12 & 54 \\
& Green & 11 & 9 & 16 & 36 \\
\cline{2-6}
& Total & 108 & 55 & 41 & 204
\end{tabular}
\end{center}
(a) What is the probability that a randomly chosen male respondent or his partner has blue eyes?
(b) What is the probability that a randomly chosen male respondent with blue eyes has a partner with blue eyes?
(c) Whatistheprobabilitythatarandomlychosenmalerespondentwithbrowneyeshasapartner with blue eyes? What about the probability of a randomly chosen male respondent with green eyes having a partner with blue eyes?
(d) Does it appear that the eye colors of male respondents and their partners are independent? Explain your reasoning.
--------------------------------------------------------------------------------
\clearpage
**Books on a bookshelf**. (3.26, p. 114) The table below shows the distribution of books on a bookcase
based on whether they are nonfiction or fiction and hardcover or paperback.
\begin{center}
\begin{tabular}{ll cc c}
& & \multicolumn{2}{c}{\textit{Format}} \\
\cline{3-4}
& & Hardcover & Paperback & Total \\
\cline{2-5}
\multirow{2}{*}{\textit{Type}} & Fiction & 13 & 59 & 72 \\
& Nonfiction& 15 & 8 & 23 \\
\cline{2-5}
& Total & 28 & 67 & 95 \\
\cline{2-5}
\end{tabular}
\end{center}
(a) Find the probability of drawing a hardcover book first then a paperback fiction book second when drawing without replacement.
(b) Determine the probability of drawing a fiction book first and then a hardcover book second, when drawing without replacement.
(c) Calculate the probability of the scenario in part (b), except this time complete the calculations under the scenario where the first book is placed back on the bookcase before randomly drawing the second book.
(d) The final answers to parts (b) and (c) are very similar. Explain why this is the case.
--------------------------------------------------------------------------------
\clearpage
**Baggage fees**. (3.34, p. 124) An airline charges the following baggage fees: $25 for the first bag and $35 for the second. Suppose 54% of passengers have no checked luggage, 34% have one piece of checked luggage and 12% have two pieces. We suppose a negligible portion of people check more than two bags.
(a) Build a probability model, compute the average revenue per passenger, and compute the corresponding standard deviation.
(b) About how much revenue should the airline expect for a flight of 120 passengers? With what standard deviation? Note any assumptions you make and if you think they are justified.
--------------------------------------------------------------------------------
\clearpage
**Income and gender**. (3.38, p. 128) The relative frequency table below displays the distribution of annual total personal income (in 2009 inflation-adjusted dollars) for a representative sample of 96,420,486 Americans. These data come from the American Community Survey for 2005-2009. This sample is comprised of 59% males and 41% females.
\begin{center}
\begin{tabular}{lr}
\hline
\textit{Income} & \textit{Total} \\
\hline
\$1 to \$9,999 or loss & 2.2\% \\
\$10,000 to \$14,999 & 4.7\% \\
\$15,000 to \$24,999 & 15.8\% \\
\$25,000 to \$34,999 & 18.3\% \\
\$35,000 to \$49,999 & 21.2\% \\
\$50,000 to \$64,999 & 13.9\% \\
\$65,000 to \$74,999 & 5.8\% \\
\$75,000 to \$99,999 & 8.4\% \\
\$100,000 or more & 9.7\% \\
\hline
\end{tabular}
\end{center}
(a) Describe the distribution of total personal income.
(b) What is the probability that a randomly chosen US
resident makes less than $50,000 per year?
(c) What is the probability that a randomly chosen US resident makes less than $50,000 per year and is female?
Note any assumptions you make.
(d) The same data source indicates that 71.8% of females
make less than $50,000 per year. Use this value to determine whether or not the assumption you made in part (c) is valid.
Data 607 Assignment 3
3. Copy the introductory example. The vector name stores the extracted names.
(a) Use the tools of this chapter to rearrange the vector so that all elements conform to
the standard first_name last_name.
(b) Construct a logical vector indicating whether a character has a title (i.e., Rev. and
Dr.).
(c) Construct a logical vector indicating whether a character has a second name.
4. Describe the types of strings that conform to the following regular expressions and
construct an example that is matched by the regular expression.
(a) [0-9]+\\$
(b) \\b[a-z]{1,4}\\b
(c) .*?\\.txt$
(d) \\d{2}/\\d{2}/\\d{4}
(e) <(.+?)>.+?</\\1>
9. The following code hides a secret message. Crack it with R and regular expressions.
Hint: Some of the characters are more revealing than others! The code snippet is also
available in the materials at www.r-datacollection.com.
clcopCow1zmstc0d87wnkig7OvdicpNuggvhryn92Gjuwczi8hqrfpRxs5Aj5dwpn0Tanwo
Uwisdij7Lj8kpf03AT5Idr3coc0bt7yczjatOaootj55t3Nj3ne6c4Sfek.r1w1YwwojigO
d6vrfUrbz2.2bkAnbhzgv4R9i05zEcrop.wAgnb.SqoU65fPa1otfb7wEm24k6t3sR9zqe5
fy89n6Nd5t9kc4fE905gmc4Rgxo5nhDk!gr
Data 606 Assignment 1
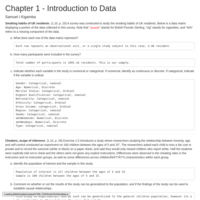
Chapter 1 - Introduction to Data
Data 606 Assignment 2
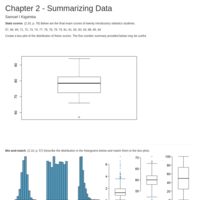
Chapter 2 - Summarizing Data
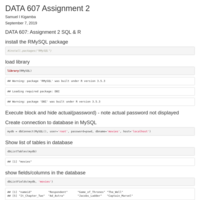
DDATA 607 Assignment 2
Choose six recent popular movies. Ask at least five people that you know (friends, family, classmates, imaginary friends) to rate each of these movie that they have seen on a scale of 1 to 5. Take the results (observations) and store them in a SQL database. Load the information into an R dataframe.
Your deliverables should include your SQL scripts and your R Markdown code, posted to GitHub.
This is by design a very open ended assignment. A variety of reasonable approaches are acceptable. You can (and should) blank out your SQL password if your solution requires it; otherwise, full credit requires that your code is “reproducible,” with the assumption that I have the same database server and R software.
You may work in a small group on this assignment. If you work in a group, each group member should indicate who they worked with, and all group members should individually submit their week 2 assignment.
Please start early, and do work that you would want to include in a “presentations portfolio” that you might share in a job interview with a potential employer! You are encouraged to share thoughts, ask, and answer clarifying questions in the “Week 2: R and SQL” forum.
Inspirational reading?: http://www.cnet.com/news/top-10-movie-recommendation-engines/
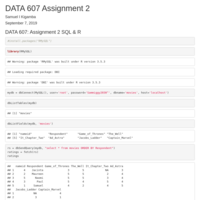
Data 607 Assignment 2
Choose six recent popular movies. Ask at least five people that you know (friends, family, classmates, imaginary friends) to rate each of these movie that they have seen on a scale of 1 to 5. Take the results (observations) and store them in a SQL database. Load the information into an R dataframe.
Your deliverables should include your SQL scripts and your R Markdown code, posted to GitHub.
This is by design a very open ended assignment. A variety of reasonable approaches are acceptable. You can (and should) blank out your SQL password if your solution requires it; otherwise, full credit requires that your code is “reproducible,” with the assumption that I have the same database server and R software.
You may work in a small group on this assignment. If you work in a group, each group member should indicate who they worked with, and all group members should individually submit their week 2 assignment.
Please start early, and do work that you would want to include in a “presentations portfolio” that you might share in a job interview with a potential employer! You are encouraged to share thoughts, ask, and answer clarifying questions in the “Week 2: R and SQL” forum.
Inspirational reading?: http://www.cnet.com/news/top-10-movie-recommendation-engines/
DATA606 Lab1
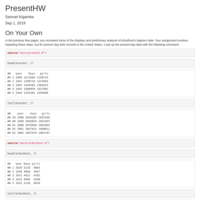
## On Your Own
In the previous few pages, you recreated some of the displays and preliminary
analysis of Arbuthnot's baptism data. Your assignment involves repeating these
steps, but for present day birth records in the United States. Load up the
present day data with the following command.
```{r load-present-data, eval=TRUE}
source("more/present.R")
```
The data are stored in a data frame called `present`.
- What years are included in this data set? What are the dimensions of the
data frame and what are the variable or column names?
- How do these counts compare to Arbuthnot's? Are they on a similar scale?
- Make a plot that displays the boy-to-girl ratio for every year in the data
set. What do you see? Does Arbuthnot's observation about boys being born in
greater proportion than girls hold up in the U.S.? Include the plot in your
response.
- In what year did we see the most total number of births in the U.S.? You can
refer to the help files or the R reference card
[http://cran.r-project.org/doc/contrib/Short-refcard.pdf](http://cran.r-project.org/doc/contrib/Short-refcard.pdf)
to find helpful commands.
These data come from a report by the Centers for Disease Control
[http://www.cdc.gov/nchs/data/nvsr/nvsr53/nvsr53_20.pdf](http://www.cdc.gov/nchs/data/nvsr/nvsr53/nvsr53_20.pdf).
Check it out if you would like to read more about an analysis of sex ratios at
birth in the United States.
That was a short introduction to R and RStudio, but we will provide you with more
functions and a more complete sense of the language as the course progresses.
Feel free to browse around the websites for [R](http://www.r-project.org) and
[RStudio](http://rstudio.org) if you're interested in learning more, or find
more labs for practice at http://openintro.org.
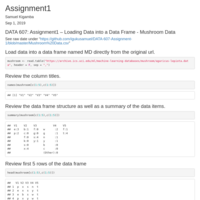
Data 607 Assignment 1
Assignment – Loading Data into a Data Frame
Your task is to study the dataset and the associated description of the data (i.e. “data dictionary”). You may need
to look around a bit, but it’s there! You should take the data, and create a data frame with a subset of the columns
in the dataset. You should include the column that indicates edible or poisonous and three or four other columns.
You should also add meaningful column names and replace the abbreviations used in the data—for example, in the
appropriate column, “e” might become “edible.” Your deliverable is the R code to perform these transformation
tasks.