
isaacmichaels
Isaac H. Michaels, MPH
Recently Published
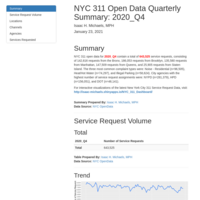
NYC 311 Open Data Quarterly Summary: 2020_Q4
Narrative, graphic, and tabular summaries of open data on NYC 311 service requests created during 2020 Q4. Author: Isaac H. Michaels, MPH. Data Source: NYC Open Data.

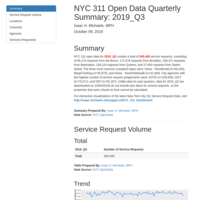
NYC 311 Open Data Quarterly Summary: 2020_Q3
Narrative, graphic, and tabular summaries of open data on NYC 311 service requests created during 2020 Q3. Author: Isaac H. Michaels, MPH. Data Source: NYC Open Data.
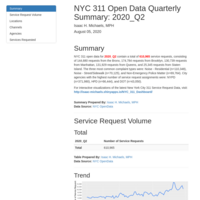
NYC 311 Open Data Quarterly Summary: 2020_Q2
Narrative, graphic, and tabular summaries of open data on NYC 311 service requests created during 2020 Q2. Author: Isaac H. Michaels, MPH. Data Source: NYC Open Data.
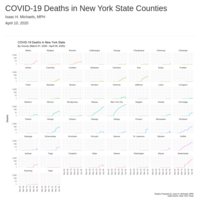
COVID-19 Deaths in New York State Counties
Time series graphs of COVID-19 deaths in New York, by county. Author: Isaac H. Michaels, MPH. Data source: New York Times.

NYC 311 Open Data Quarterly Summary: 2020_Q1
Narrative, graphic, and tabular summaries of open data on NYC 311 service requests created during 2020 Q1. Author: Isaac H. Michaels, MPH. Data Source: NYC Open Data.
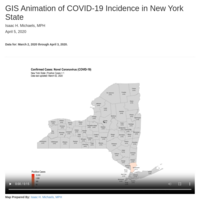
GIS Animation of COVID-19 Incidence in New York State
Animated choropleth map of coronavirus (COVID-19) confirmed cases for New York State. Author: Isaac H. Michaels, MPH. Data source: Health Data NY
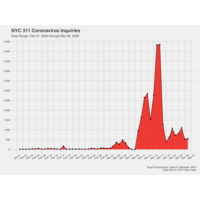
NYC 311 Coronavirus Inquiries
Trend graph of coronavirus-related inquiries to NYC 311 from February 1, 2020 to March 26, 2020. Daily counts capture inquiries for which the recorded description contains any mention of "coronavirus." Author: Isaac H. Michaels, MPH. Data source: NYC Open Data.
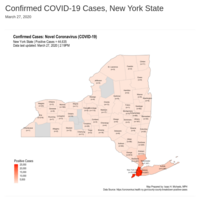
Choropleth Map: Confirmed COVID-19 Cases, New York State
UPDATED: Choropleth map of coronavirus (COVID-19) confirmed cases for New York State. Author: Isaac H. Michaels, MPH. Data source: https://coronavirus.health.ny.gov/county-county-breakdown-positive-cases
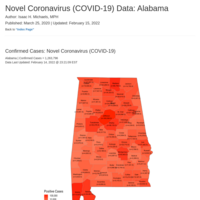
Confirmed COVID-19 Cases: Alabama
Choropleth map of coronavirus (COVID-19) incidence data for Alabama. Author: Isaac H. Michaels, MPH. Data source: Johns Hopkins Center for Systems Science and Engineering (CSSE).
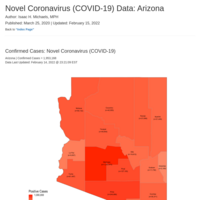
Confirmed COVID-19 Cases: Arizona
Choropleth map of coronavirus (COVID-19) incidence data for Arizona. Author: Isaac H. Michaels, MPH. Data source: Johns Hopkins Center for Systems Science and Engineering (CSSE).
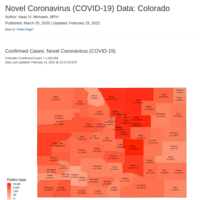
Confirmed COVID-19 Cases: Colorado
Choropleth map of coronavirus (COVID-19) incidence data for Colorado. Author: Isaac H. Michaels, MPH. Data source: Johns Hopkins Center for Systems Science and Engineering (CSSE).
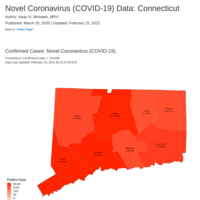
Confirmed COVID-19 Cases: Connecticut
Choropleth map of coronavirus (COVID-19) incidence data for Connecticut. Author: Isaac H. Michaels, MPH. Data source: Johns Hopkins Center for Systems Science and Engineering (CSSE).
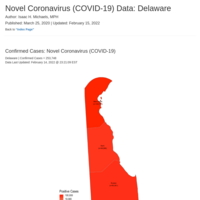
Confirmed COVID-19 Cases: Delaware
Choropleth map of coronavirus (COVID-19) incidence data for Delaware. Author: Isaac H. Michaels, MPH. Data source: Johns Hopkins Center for Systems Science and Engineering (CSSE).
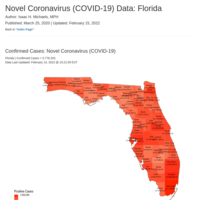
Confirmed COVID-19 Cases: Florida
Choropleth map of coronavirus (COVID-19) incidence data for Florida. Author: Isaac H. Michaels, MPH. Data source: Johns Hopkins Center for Systems Science and Engineering (CSSE).
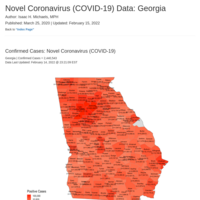
Confirmed COVID-19 Cases: Georgia
Choropleth map of coronavirus (COVID-19) incidence data for Georgia. Author: Isaac H. Michaels, MPH. Data source: Johns Hopkins Center for Systems Science and Engineering (CSSE).
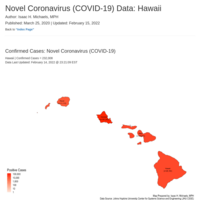
Confirmed COVID-19 Cases: Hawaii
Choropleth map of coronavirus (COVID-19) incidence data for Hawaii. Author: Isaac H. Michaels, MPH. Data source: Johns Hopkins Center for Systems Science and Engineering (CSSE).
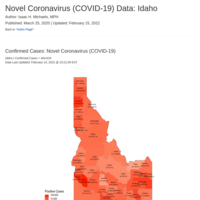
Confirmed COVID-19 Cases: Idaho
Choropleth map of coronavirus (COVID-19) incidence data for Idaho. Author: Isaac H. Michaels, MPH. Data source: Johns Hopkins Center for Systems Science and Engineering (CSSE).
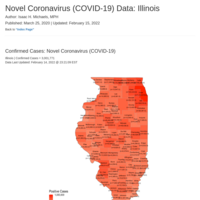
Confirmed COVID-19 Cases: Illinois
Choropleth map of coronavirus (COVID-19) incidence data for Illinois. Author: Isaac H. Michaels, MPH. Data source: Johns Hopkins Center for Systems Science and Engineering (CSSE).
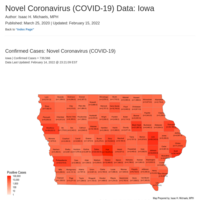
Confirmed COVID-19 Cases: Iowa
Choropleth map of coronavirus (COVID-19) incidence data for Iowa. Author: Isaac H. Michaels, MPH. Data source: Johns Hopkins Center for Systems Science and Engineering (CSSE).
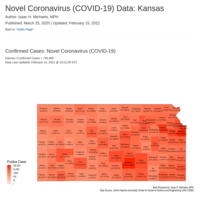
Confirmed COVID-19 Cases: Kansas
Choropleth map of coronavirus (COVID-19) incidence data for Kansas. Author: Isaac H. Michaels, MPH. Data source: Johns Hopkins Center for Systems Science and Engineering (CSSE).
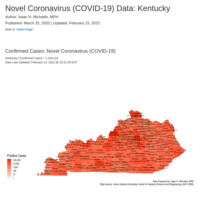
Confirmed COVID-19 Cases: Kentucky
Choropleth map of coronavirus (COVID-19) incidence data for Kentucky. Author: Isaac H. Michaels, MPH. Data source: Johns Hopkins Center for Systems Science and Engineering (CSSE).
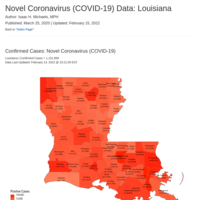
Confirmed COVID-19 Cases: Louisiana
Choropleth map of coronavirus (COVID-19) incidence data for Louisiana. Author: Isaac H. Michaels, MPH. Data source: Johns Hopkins Center for Systems Science and Engineering (CSSE).
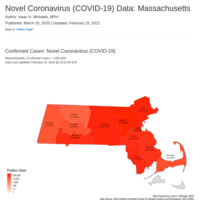
Confirmed COVID-19 Cases: Massachusetts
Choropleth map of coronavirus (COVID-19) incidence data for Massachusetts. Author: Isaac H. Michaels, MPH. Data source: Johns Hopkins Center for Systems Science and Engineering (CSSE).
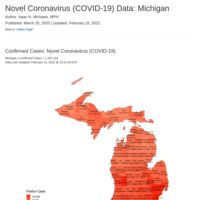
Confirmed COVID-19 Cases: Michigan
Choropleth map of coronavirus (COVID-19) incidence data for Michigan. Author: Isaac H. Michaels, MPH. Data source: Johns Hopkins Center for Systems Science and Engineering (CSSE).
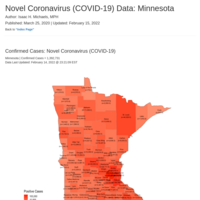
Confirmed COVID-19 Cases: Minnesota
Choropleth map of coronavirus (COVID-19) incidence data for Minnesota. Author: Isaac H. Michaels, MPH. Data source: Johns Hopkins Center for Systems Science and Engineering (CSSE).
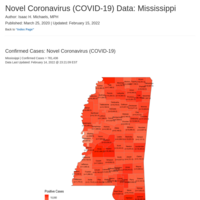
Confirmed COVID-19 Cases: Mississippi
Choropleth map of coronavirus (COVID-19) incidence data for Mississippi. Author: Isaac H. Michaels, MPH. Data source: Johns Hopkins Center for Systems Science and Engineering (CSSE).
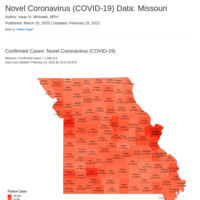
Confirmed COVID-19 Cases: Missouri
Choropleth map of coronavirus (COVID-19) incidence data for Missouri. Author: Isaac H. Michaels, MPH. Data source: Johns Hopkins Center for Systems Science and Engineering (CSSE).

Confirmed COVID-19 Cases: Montana
Choropleth map of coronavirus (COVID-19) incidence data for Montana. Author: Isaac H. Michaels, MPH. Data source: Johns Hopkins Center for Systems Science and Engineering (CSSE).
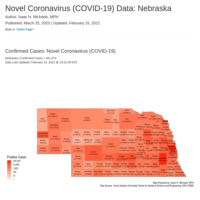
Confirmed COVID-19 Cases: Nebraska
Choropleth map of coronavirus (COVID-19) incidence data for Nebraska. Author: Isaac H. Michaels, MPH. Data source: Johns Hopkins Center for Systems Science and Engineering (CSSE).
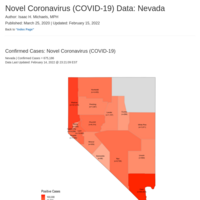
Confirmed COVID-19 Cases: Nevada
Choropleth map of coronavirus (COVID-19) incidence data for Nevada. Author: Isaac H. Michaels, MPH. Data source: Johns Hopkins Center for Systems Science and Engineering (CSSE).
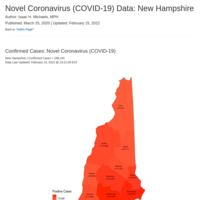
Confirmed COVID-19 Cases: New Hampshire
Choropleth map of coronavirus (COVID-19) incidence data for New Hampshire. Author: Isaac H. Michaels, MPH. Data source: Johns Hopkins Center for Systems Science and Engineering (CSSE).
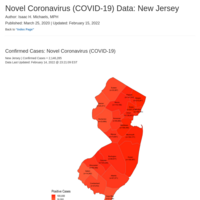
Confirmed COVID-19 Cases: New Jersey
Choropleth map of coronavirus (COVID-19) incidence data for New Jersey. Author: Isaac H. Michaels, MPH. Data source: Johns Hopkins Center for Systems Science and Engineering (CSSE).
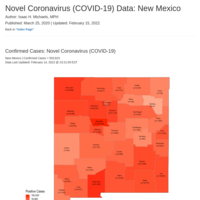
Confirmed COVID-19 Cases: New Mexico
Choropleth map of coronavirus (COVID-19) incidence data for New Mexico. Author: Isaac H. Michaels, MPH. Data source: Johns Hopkins Center for Systems Science and Engineering (CSSE).
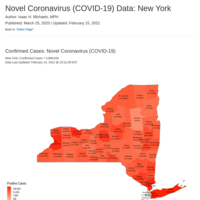
Confirmed COVID-19 Cases: New York
Choropleth map of coronavirus (COVID-19) incidence data for New York. Author: Isaac H. Michaels, MPH. Data source: Johns Hopkins Center for Systems Science and Engineering (CSSE).
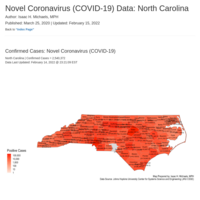
Confirmed COVID-19 Cases: North Carolina
Choropleth map of coronavirus (COVID-19) incidence data for North Carolina. Author: Isaac H. Michaels, MPH. Data source: Johns Hopkins Center for Systems Science and Engineering (CSSE).
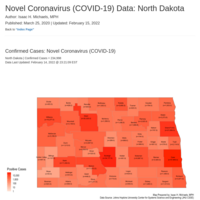
Confirmed COVID-19 Cases: North Dakota
Choropleth map of coronavirus (COVID-19) incidence data for North Dakota. Author: Isaac H. Michaels, MPH. Data source: Johns Hopkins Center for Systems Science and Engineering (CSSE).
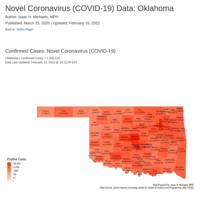
Confirmed COVID-19 Cases: Oklahoma
Choropleth map of coronavirus (COVID-19) incidence data for Oklahoma. Author: Isaac H. Michaels, MPH. Data source: Johns Hopkins Center for Systems Science and Engineering (CSSE).
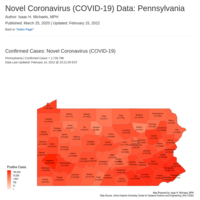
Confirmed COVID-19 Cases: Pennsylvania
Choropleth map of coronavirus (COVID-19) incidence data for Pennsylvania. Author: Isaac H. Michaels, MPH. Data source: Johns Hopkins Center for Systems Science and Engineering (CSSE).
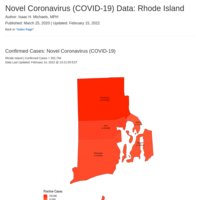
Confirmed COVID-19 Cases: Rhode Island
Choropleth map of coronavirus (COVID-19) incidence data for Rhode Island. Author: Isaac H. Michaels, MPH. Data source: Johns Hopkins Center for Systems Science and Engineering (CSSE).
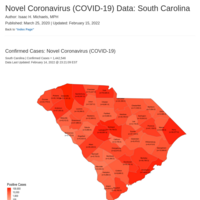
Confirmed COVID-19 Cases: South Carolina
Choropleth map of coronavirus (COVID-19) incidence data for South Carolina. Author: Isaac H. Michaels, MPH. Data source: Johns Hopkins Center for Systems Science and Engineering (CSSE).
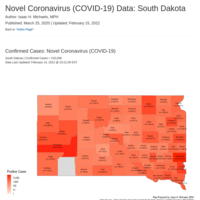
Confirmed COVID-19 Cases: South Dakota
Choropleth map of coronavirus (COVID-19) incidence data for South Dakota. Author: Isaac H. Michaels, MPH. Data source: Johns Hopkins Center for Systems Science and Engineering (CSSE).
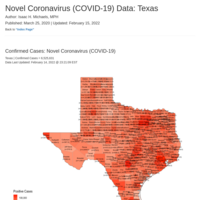
Confirmed COVID-19 Cases: Texas
Choropleth map of coronavirus (COVID-19) incidence data for Texas. Author: Isaac H. Michaels, MPH. Data source: Johns Hopkins Center for Systems Science and Engineering (CSSE).
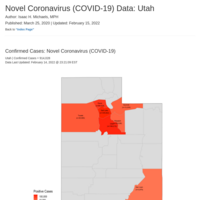
Confirmed COVID-19 Cases: Utah
Choropleth map of coronavirus (COVID-19) incidence data for Utah. Author: Isaac H. Michaels, MPH. Data source: Johns Hopkins Center for Systems Science and Engineering (CSSE).
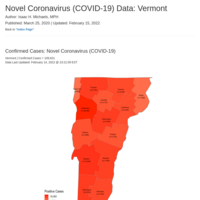
Confirmed COVID-19 Cases: Vermont
Choropleth map of coronavirus (COVID-19) incidence data for Vermont. Author: Isaac H. Michaels, MPH. Data source: Johns Hopkins Center for Systems Science and Engineering (CSSE).
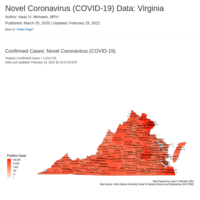
Confirmed COVID-19 Cases: Virginia
Choropleth map of coronavirus (COVID-19) incidence data for Virginia. Author: Isaac H. Michaels, MPH. Data source: Johns Hopkins Center for Systems Science and Engineering (CSSE).
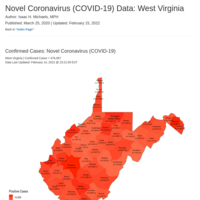
Confirmed COVID-19 Cases: West Virginia
Choropleth map of coronavirus (COVID-19) incidence data for West Virginia. Author: Isaac H. Michaels, MPH. Data source: Johns Hopkins Center for Systems Science and Engineering (CSSE).
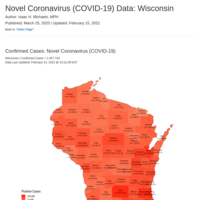
Confirmed COVID-19 Cases: Wisconsin
Choropleth map of coronavirus (COVID-19) incidence data for Wisconsin. Author: Isaac H. Michaels, MPH. Data source: Johns Hopkins Center for Systems Science and Engineering (CSSE).

Confirmed COVID-19 Cases: Wyoming
Choropleth map of coronavirus (COVID-19) incidence data for Hawaii. Author: Isaac H. Michaels, MPH. Data source: Johns Hopkins Center for Systems Science and Engineering (CSSE).
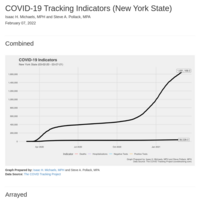
COVID-19 Tracking Indicators (New York State)
UPDATED: Time series graph of coronavirus (COVID-19) indicator data for New York State. Authors: Isaac H. Michaels, MPH and Steve Pollack, MPA. Data source: The COVID Tracking Project (https://covidtracking.com).
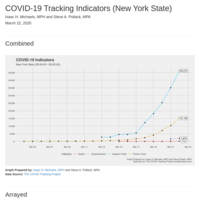
COVID-19 Tracking Indicators (New York State)
Time series graph of coronavirus (COVID-19) indicator data for New York State. Authors: Isaac H. Michaels, MPH and Steve Pollack, MPA. Data source: The COVID Tracking Project (https://covidtracking.com).
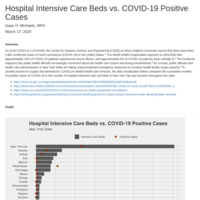
Hospital Intensive Care Beds vs. COVID-19 Positive Cases (New York State)
Graph of hospital intensive care beds vs. COVID-19 positive cases in New York City, and New York State counties outside of New York City. Author: Isaac H. Michaels, MPH. Data sources: Health Data NY, and https://health.ny.gov/diseases/communicable/coronavirus/.
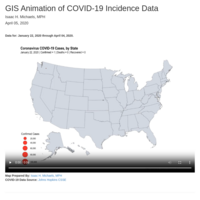
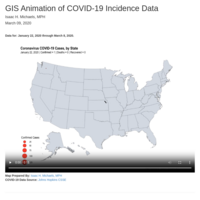
GIS Animation of COVID-19 Incidence Data
UPDATED: Animated point map of coronavirus (COVID-19) incidence data, aggregated to the state level, for the United States beginning on 1/22/2020. Author: Isaac H. Michaels, MPH. Data source: Johns Hopkins Center for Systems Science and Engineering (CSSE).
GIS Animation of COVID-19 Incidence Data
Animated point map of coronavirus (COVID-19) incidence data, aggregated to the state level, for the United States beginning on 1/22/2020. Author: Isaac H. Michaels, MPH. Data source: Johns Hopkins Center for Systems Science and Engineering (CSSE).
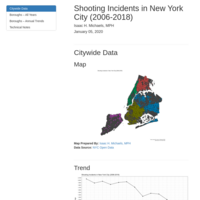
Shooting Incidents in New York City (2006-2018)
Spatial, graphic, and tabular summaries of open data on shooting incidents in New York City during 2006-2018. Author: Isaac H. Michaels, MPH. Data source: NYC Open Data.
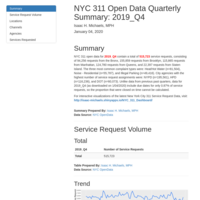
NYC 311 Open Data Quarterly Summary: 2019_Q4
Narrative, graphic, and tabular summaries of open data on NYC 311 service requests created during 2019 Q4. Author: Isaac H. Michaels, MPH. Data source: NYC Open Data.
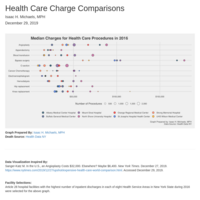
Health Care Charge Comparisons (New York State Hospitals, 2016)
Graphic comparisons of median charges for ten health care procedures among eight Article 28 hospital facilities in New York State during 2016. Data Source: Health Data NY.
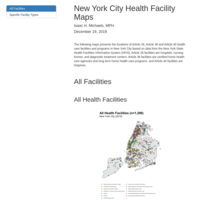
New York City Health Facility Maps
Maps showing the locations of healthcare facilities in New York State. Maps prepared by: Isaac H. Michaels, MPH. Data source is Health Data NY.
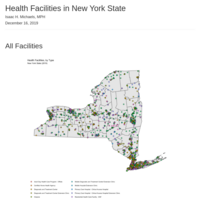
New York State Health Facility Maps
Maps showing the locations of healthcare facilities in New York State. Maps prepared by: Isaac H. Michaels, MPH. Data source is Health Data NY.
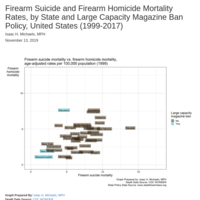
Firearm Suicide and Firearm Homicide Mortality Rates, by State and Large Capacity Magazine Ban Policy, United States (1999-2017)
Animated graph showing age-adjusted mortality rate per 100,000 population for firearm suicides vs. firearm homicides, by state, during 1999-2017. The labels are shaded according to whether the respective state, during the respective year, had a large capacity magazine ban law in place. Graph is prepared by: Isaac H. Michaels, MPH. Mortality data source is CDC WONDER: United States Department of Health and Human Services (US DHHS), Centers for Disease Control and Prevention (CDC), National Center for Health Statistics (NCHS), Multiple Cause of Death 1999-2017 on CDC WONDER Online Database, released 2018. Data are compiled from data provided by the 57 vital statistics jurisdictions through the Vital Statistics Cooperative Program. State gun policy data source is www.statefirearmlaws.org.
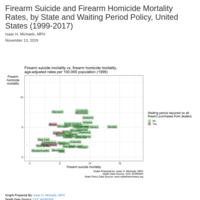
Firearm Suicide and Firearm Homicide Mortality Rates, by State and Mandatory Minimum Waiting Period Policy, United States (1999-2017)
Animated graph showing age-adjusted mortality rate per 100,000 population for firearm suicides vs. firearm homicides, by state, during 1999-2017. The labels are shaded according to whether the respective state, during the respective year, had a mandatory minimum waiting period law in place for firearm purchases. Graph is prepared by: Isaac H. Michaels, MPH. Mortality data source is CDC WONDER: United States Department of Health and Human Services (US DHHS), Centers for Disease Control and Prevention (CDC), National Center for Health Statistics (NCHS), Multiple Cause of Death 1999-2017 on CDC WONDER Online Database, released 2018. Data are compiled from data provided by the 57 vital statistics jurisdictions through the Vital Statistics Cooperative Program. State gun policy data source is www.statefirearmlaws.org.
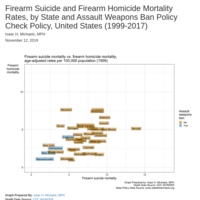
Firearm Suicide and Firearm Homicide Mortality Rates, by State and Assault Weapons Ban Policy, United States (1999-2017)
Animated graph showing age-adjusted mortality rate per 100,000 population for firearm suicides vs. firearm homicides, by state, during 1999-2017. The labels are shaded according to whether the respective state, during the respective year, had an assault weapons ban law in place. Graph is prepared by: Isaac H. Michaels, MPH. Mortality data source is CDC WONDER: United States Department of Health and Human Services (US DHHS), Centers for Disease Control and Prevention (CDC), National Center for Health Statistics (NCHS), Multiple Cause of Death 1999-2017 on CDC WONDER Online Database, released 2018. Data are compiled from data provided by the 57 vital statistics jurisdictions through the Vital Statistics Cooperative Program. State gun policy data source is www.statefirearmlaws.org.
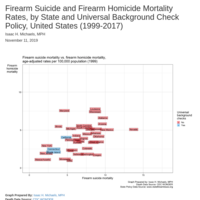
Firearm Suicide and Firearm Homicide Mortality Rates, by State and Universal Background Check Policy, United States (1999-2017)
Animated graph showing age-adjusted mortality rate per 100,000 population for firearm suicides vs. firearm homicides, by state, during 1999-2017. The labels are shaded according to whether the respective state, during the respective year, had a universal background check law in place for firearm purchases. Graph is prepared by: Isaac H. Michaels, MPH. Mortality data source is CDC WONDER: United States Department of Health and Human Services (US DHHS), Centers for Disease Control and Prevention (CDC), National Center for Health Statistics (NCHS), Multiple Cause of Death 1999-2017 on CDC WONDER Online Database, released 2018. Data are compiled from data provided by the 57 vital statistics jurisdictions through the Vital Statistics Cooperative Program. State gun policy data source is www.statefirearmlaws.org.
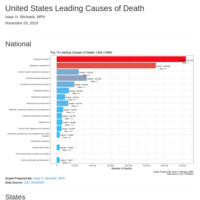
Top 15 Leading Causes of Death, United States (1999-2017)
Animated graph showing the top 15 leading causes of death among United States residents, by year, during 1999-2017. Graph is prepared by: Isaac H. Michaels, MPH. Data source is CDC WONDER: United States Department of Health and Human Services (US DHHS), Centers for Disease Control and Prevention (CDC), National Center for Health Statistics (NCHS), Underlying Cause of Death 1999-2017 on CDC WONDER Online Database, released 2018. Data are compiled from data provided by the 57 vital statistics jurisdictions through the Vital Statistics Cooperative Program.
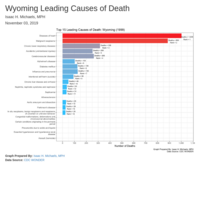
Top 15 Leading Causes of Death, Wyoming (1999-2017)
Animated graph showing the top 15 leading causes of death among Wyoming residents, by year, during 1999-2017. Graph is prepared by: Isaac H. Michaels, MPH. Data source is CDC WONDER: United States Department of Health and Human Services (US DHHS), Centers for Disease Control and Prevention (CDC), National Center for Health Statistics (NCHS), Underlying Cause of Death 1999-2017 on CDC WONDER Online Database, released 2018. Data are compiled from data provided by the 57 vital statistics jurisdictions through the Vital Statistics Cooperative Program.
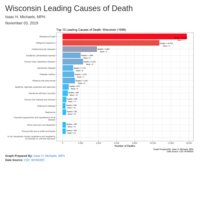
Top 15 Leading Causes of Death, Wisconsin (1999-2017)
Animated graph showing the top 15 leading causes of death among Wisconsin residents, by year, during 1999-2017. Graph is prepared by: Isaac H. Michaels, MPH. Data source is CDC WONDER: United States Department of Health and Human Services (US DHHS), Centers for Disease Control and Prevention (CDC), National Center for Health Statistics (NCHS), Underlying Cause of Death 1999-2017 on CDC WONDER Online Database, released 2018. Data are compiled from data provided by the 57 vital statistics jurisdictions through the Vital Statistics Cooperative Program.
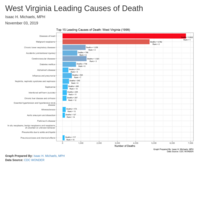
Top 15 Leading Causes of Death, West Virginia (1999-2017)
Animated graph showing the top 15 leading causes of death among West Virginia residents, by year, during 1999-2017. Graph is prepared by: Isaac H. Michaels, MPH. Data source is CDC WONDER: United States Department of Health and Human Services (US DHHS), Centers for Disease Control and Prevention (CDC), National Center for Health Statistics (NCHS), Underlying Cause of Death 1999-2017 on CDC WONDER Online Database, released 2018. Data are compiled from data provided by the 57 vital statistics jurisdictions through the Vital Statistics Cooperative Program.
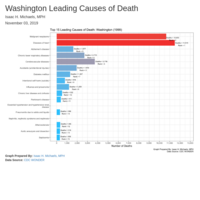
Top 15 Leading Causes of Death, Washington (1999-2017)
Animated graph showing the top 15 leading causes of death among Washington residents, by year, during 1999-2017. Graph is prepared by: Isaac H. Michaels, MPH. Data source is CDC WONDER: United States Department of Health and Human Services (US DHHS), Centers for Disease Control and Prevention (CDC), National Center for Health Statistics (NCHS), Underlying Cause of Death 1999-2017 on CDC WONDER Online Database, released 2018. Data are compiled from data provided by the 57 vital statistics jurisdictions through the Vital Statistics Cooperative Program.
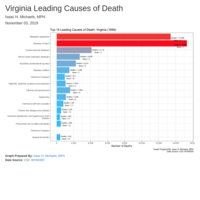
Top 15 Leading Causes of Death, Virginia (1999-2017)
Animated graph showing the top 15 leading causes of death among Virginia residents, by year, during 1999-2017. Graph is prepared by: Isaac H. Michaels, MPH. Data source is CDC WONDER: United States Department of Health and Human Services (US DHHS), Centers for Disease Control and Prevention (CDC), National Center for Health Statistics (NCHS), Underlying Cause of Death 1999-2017 on CDC WONDER Online Database, released 2018. Data are compiled from data provided by the 57 vital statistics jurisdictions through the Vital Statistics Cooperative Program.
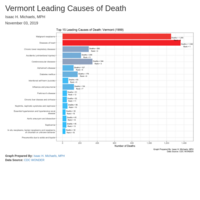
Top 15 Leading Causes of Death, Vermont (1999-2017)
Animated graph showing the top 15 leading causes of death among Vermont residents, by year, during 1999-2017. Graph is prepared by: Isaac H. Michaels, MPH. Data source is CDC WONDER: United States Department of Health and Human Services (US DHHS), Centers for Disease Control and Prevention (CDC), National Center for Health Statistics (NCHS), Underlying Cause of Death 1999-2017 on CDC WONDER Online Database, released 2018. Data are compiled from data provided by the 57 vital statistics jurisdictions through the Vital Statistics Cooperative Program.
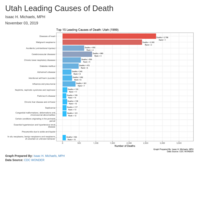
Top 15 Leading Causes of Death, Utah (1999-2017)
Animated graph showing the top 15 leading causes of death among Utah residents, by year, during 1999-2017. Graph is prepared by: Isaac H. Michaels, MPH. Data source is CDC WONDER: United States Department of Health and Human Services (US DHHS), Centers for Disease Control and Prevention (CDC), National Center for Health Statistics (NCHS), Underlying Cause of Death 1999-2017 on CDC WONDER Online Database, released 2018. Data are compiled from data provided by the 57 vital statistics jurisdictions through the Vital Statistics Cooperative Program.

Top 15 Leading Causes of Death, Texas (1999-2017)
Animated graph showing the top 15 leading causes of death among Texas residents, by year, during 1999-2017. Graph is prepared by: Isaac H. Michaels, MPH. Data source is CDC WONDER: United States Department of Health and Human Services (US DHHS), Centers for Disease Control and Prevention (CDC), National Center for Health Statistics (NCHS), Underlying Cause of Death 1999-2017 on CDC WONDER Online Database, released 2018. Data are compiled from data provided by the 57 vital statistics jurisdictions through the Vital Statistics Cooperative Program.
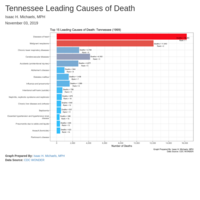
Top 15 Leading Causes of Death, Tennessee (1999-2017)
Animated graph showing the top 15 leading causes of death among Tennessee residents, by year, during 1999-2017. Graph is prepared by: Isaac H. Michaels, MPH. Data source is CDC WONDER: United States Department of Health and Human Services (US DHHS), Centers for Disease Control and Prevention (CDC), National Center for Health Statistics (NCHS), Underlying Cause of Death 1999-2017 on CDC WONDER Online Database, released 2018. Data are compiled from data provided by the 57 vital statistics jurisdictions through the Vital Statistics Cooperative Program.
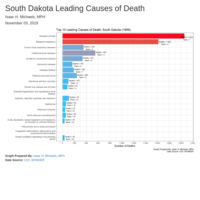
Top 15 Leading Causes of Death, South Dakota (1999-2017)
Animated graph showing the top 15 leading causes of death among South Dakota residents, by year, during 1999-2017. Graph is prepared by: Isaac H. Michaels, MPH. Data source is CDC WONDER: United States Department of Health and Human Services (US DHHS), Centers for Disease Control and Prevention (CDC), National Center for Health Statistics (NCHS), Underlying Cause of Death 1999-2017 on CDC WONDER Online Database, released 2018. Data are compiled from data provided by the 57 vital statistics jurisdictions through the Vital Statistics Cooperative Program.
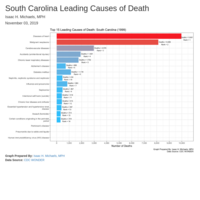
Top 15 Leading Causes of Death, South Carolina (1999-2017)
Animated graph showing the top 15 leading causes of death among South Carolina residents, by year, during 1999-2017. Graph is prepared by: Isaac H. Michaels, MPH. Data source is CDC WONDER: United States Department of Health and Human Services (US DHHS), Centers for Disease Control and Prevention (CDC), National Center for Health Statistics (NCHS), Underlying Cause of Death 1999-2017 on CDC WONDER Online Database, released 2018. Data are compiled from data provided by the 57 vital statistics jurisdictions through the Vital Statistics Cooperative Program.
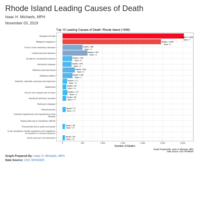
Top 15 Leading Causes of Death, Rhode Island (1999-2017)
Animated graph showing the top 15 leading causes of death among Rhode Island residents, by year, during 1999-2017. Graph is prepared by: Isaac H. Michaels, MPH. Data source is CDC WONDER: United States Department of Health and Human Services (US DHHS), Centers for Disease Control and Prevention (CDC), National Center for Health Statistics (NCHS), Underlying Cause of Death 1999-2017 on CDC WONDER Online Database, released 2018. Data are compiled from data provided by the 57 vital statistics jurisdictions through the Vital Statistics Cooperative Program.
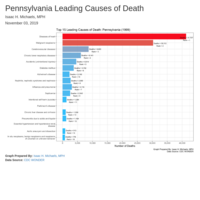
Top 15 Leading Causes of Death, Pennsylvania (1999-2017)
Animated graph showing the top 15 leading causes of death among Pennsylvania residents, by year, during 1999-2017. Graph is prepared by: Isaac H. Michaels, MPH. Data source is CDC WONDER: United States Department of Health and Human Services (US DHHS), Centers for Disease Control and Prevention (CDC), National Center for Health Statistics (NCHS), Underlying Cause of Death 1999-2017 on CDC WONDER Online Database, released 2018. Data are compiled from data provided by the 57 vital statistics jurisdictions through the Vital Statistics Cooperative Program.
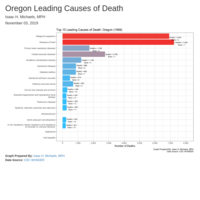
Top 15 Leading Causes of Death, Oregon (1999-2017)
Animated graph showing the top 15 leading causes of death among Oregon residents, by year, during 1999-2017. Graph is prepared by: Isaac H. Michaels, MPH. Data source is CDC WONDER: United States Department of Health and Human Services (US DHHS), Centers for Disease Control and Prevention (CDC), National Center for Health Statistics (NCHS), Underlying Cause of Death 1999-2017 on CDC WONDER Online Database, released 2018. Data are compiled from data provided by the 57 vital statistics jurisdictions through the Vital Statistics Cooperative Program.
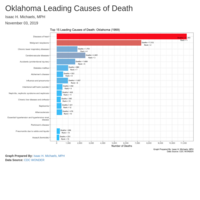
Top 15 Leading Causes of Death, Oklahoma (1999-2017)
Animated graph showing the top 15 leading causes of death among Oklahoma residents, by year, during 1999-2017. Graph is prepared by: Isaac H. Michaels, MPH. Data source is CDC WONDER: United States Department of Health and Human Services (US DHHS), Centers for Disease Control and Prevention (CDC), National Center for Health Statistics (NCHS), Underlying Cause of Death 1999-2017 on CDC WONDER Online Database, released 2018. Data are compiled from data provided by the 57 vital statistics jurisdictions through the Vital Statistics Cooperative Program.

Top 15 Leading Causes of Death, Ohio (1999-2017)
Animated graph showing the top 15 leading causes of death among Ohio residents, by year, during 1999-2017. Graph is prepared by: Isaac H. Michaels, MPH. Data source is CDC WONDER: United States Department of Health and Human Services (US DHHS), Centers for Disease Control and Prevention (CDC), National Center for Health Statistics (NCHS), Underlying Cause of Death 1999-2017 on CDC WONDER Online Database, released 2018. Data are compiled from data provided by the 57 vital statistics jurisdictions through the Vital Statistics Cooperative Program.
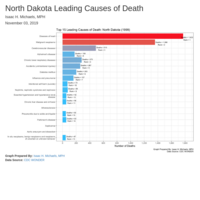
Top 15 Leading Causes of Death, North Dakota (1999-2017)
Animated graph showing the top 15 leading causes of death among North Dakota residents, by year, during 1999-2017. Graph is prepared by: Isaac H. Michaels, MPH. Data source is CDC WONDER: United States Department of Health and Human Services (US DHHS), Centers for Disease Control and Prevention (CDC), National Center for Health Statistics (NCHS), Underlying Cause of Death 1999-2017 on CDC WONDER Online Database, released 2018. Data are compiled from data provided by the 57 vital statistics jurisdictions through the Vital Statistics Cooperative Program.
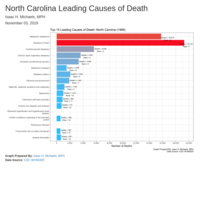
Top 15 Leading Causes of Death, North Carolina (1999-2017)
Animated graph showing the top 15 leading causes of death among North Carolina residents, by year, during 1999-2017. Graph is prepared by: Isaac H. Michaels, MPH. Data source is CDC WONDER: United States Department of Health and Human Services (US DHHS), Centers for Disease Control and Prevention (CDC), National Center for Health Statistics (NCHS), Underlying Cause of Death 1999-2017 on CDC WONDER Online Database, released 2018. Data are compiled from data provided by the 57 vital statistics jurisdictions through the Vital Statistics Cooperative Program.
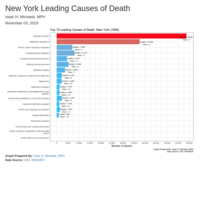
Top 15 Leading Causes of Death, New York (1999-2017)
Animated graph showing the top 15 leading causes of death among New York residents, by year, during 1999-2017. Graph is prepared by: Isaac H. Michaels, MPH. Data source is CDC WONDER: United States Department of Health and Human Services (US DHHS), Centers for Disease Control and Prevention (CDC), National Center for Health Statistics (NCHS), Underlying Cause of Death 1999-2017 on CDC WONDER Online Database, released 2018. Data are compiled from data provided by the 57 vital statistics jurisdictions through the Vital Statistics Cooperative Program.
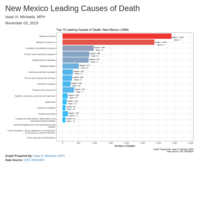
Top 15 Leading Causes of Death, New Mexico (1999-2017)
Animated graph showing the top 15 leading causes of death among New Mexico residents, by year, during 1999-2017. Graph is prepared by: Isaac H. Michaels, MPH. Data source is CDC WONDER: United States Department of Health and Human Services (US DHHS), Centers for Disease Control and Prevention (CDC), National Center for Health Statistics (NCHS), Underlying Cause of Death 1999-2017 on CDC WONDER Online Database, released 2018. Data are compiled from data provided by the 57 vital statistics jurisdictions through the Vital Statistics Cooperative Program.
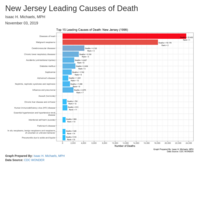
Top 15 Leading Causes of Death, New Jersey (1999-2017)
Animated graph showing the top 15 leading causes of death among New Jersey residents, by year, during 1999-2017. Graph is prepared by: Isaac H. Michaels, MPH. Data source is CDC WONDER: United States Department of Health and Human Services (US DHHS), Centers for Disease Control and Prevention (CDC), National Center for Health Statistics (NCHS), Underlying Cause of Death 1999-2017 on CDC WONDER Online Database, released 2018. Data are compiled from data provided by the 57 vital statistics jurisdictions through the Vital Statistics Cooperative Program.
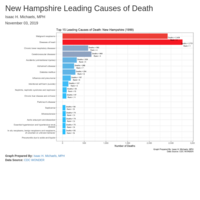
Top 15 Leading Causes of Death, New Hampshire (1999-2017)
Animated graph showing the top 15 leading causes of death among New Hampshire residents, by year, during 1999-2017. Graph is prepared by: Isaac H. Michaels, MPH. Data source is CDC WONDER: United States Department of Health and Human Services (US DHHS), Centers for Disease Control and Prevention (CDC), National Center for Health Statistics (NCHS), Underlying Cause of Death 1999-2017 on CDC WONDER Online Database, released 2018. Data are compiled from data provided by the 57 vital statistics jurisdictions through the Vital Statistics Cooperative Program.
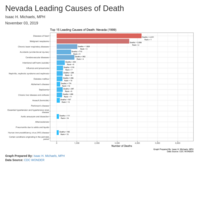
Top 15 Leading Causes of Death, Nevada (1999-2017)
Animated graph showing the top 15 leading causes of death among Nevada residents, by year, during 1999-2017. Graph is prepared by: Isaac H. Michaels, MPH. Data source is CDC WONDER: United States Department of Health and Human Services (US DHHS), Centers for Disease Control and Prevention (CDC), National Center for Health Statistics (NCHS), Underlying Cause of Death 1999-2017 on CDC WONDER Online Database, released 2018. Data are compiled from data provided by the 57 vital statistics jurisdictions through the Vital Statistics Cooperative Program.
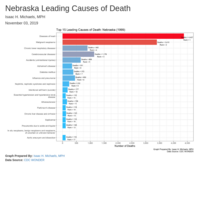
Top 15 Leading Causes of Death, Nebraska (1999-2017)
Animated graph showing the top 15 leading causes of death among Nebraska residents, by year, during 1999-2017. Graph is prepared by: Isaac H. Michaels, MPH. Data source is CDC WONDER: United States Department of Health and Human Services (US DHHS), Centers for Disease Control and Prevention (CDC), National Center for Health Statistics (NCHS), Underlying Cause of Death 1999-2017 on CDC WONDER Online Database, released 2018. Data are compiled from data provided by the 57 vital statistics jurisdictions through the Vital Statistics Cooperative Program.
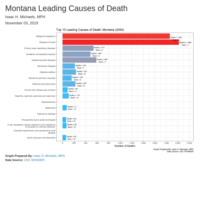
Top 15 Leading Causes of Death, Montana (1999-2017)
Animated graph showing the top 15 leading causes of death among Montana residents, by year, during 1999-2017. Graph is prepared by: Isaac H. Michaels, MPH. Data source is CDC WONDER: United States Department of Health and Human Services (US DHHS), Centers for Disease Control and Prevention (CDC), National Center for Health Statistics (NCHS), Underlying Cause of Death 1999-2017 on CDC WONDER Online Database, released 2018. Data are compiled from data provided by the 57 vital statistics jurisdictions through the Vital Statistics Cooperative Program.
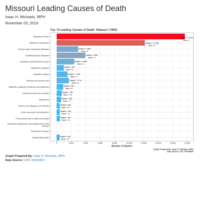
Top 15 Leading Causes of Death, Missouri (1999-2017)
Animated graph showing the top 15 leading causes of death among Missouri residents, by year, during 1999-2017. Graph is prepared by: Isaac H. Michaels, MPH. Data source is CDC WONDER: United States Department of Health and Human Services (US DHHS), Centers for Disease Control and Prevention (CDC), National Center for Health Statistics (NCHS), Underlying Cause of Death 1999-2017 on CDC WONDER Online Database, released 2018. Data are compiled from data provided by the 57 vital statistics jurisdictions through the Vital Statistics Cooperative Program.
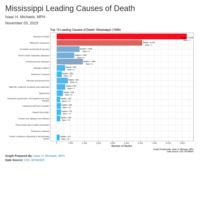
Top 15 Leading Causes of Death, Mississippi (1999-2017)
Animated graph showing the top 15 leading causes of death among Mississippi residents, by year, during 1999-2017. Graph is prepared by: Isaac H. Michaels, MPH. Data source is CDC WONDER: United States Department of Health and Human Services (US DHHS), Centers for Disease Control and Prevention (CDC), National Center for Health Statistics (NCHS), Underlying Cause of Death 1999-2017 on CDC WONDER Online Database, released 2018. Data are compiled from data provided by the 57 vital statistics jurisdictions through the Vital Statistics Cooperative Program.
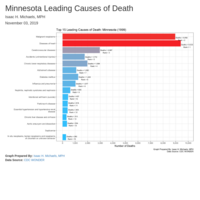
Top 15 Leading Causes of Death, Minnesota (1999-2017)
Animated graph showing the top 15 leading causes of death among Minnesota residents, by year, during 1999-2017. Graph is prepared by: Isaac H. Michaels, MPH. Data source is CDC WONDER: United States Department of Health and Human Services (US DHHS), Centers for Disease Control and Prevention (CDC), National Center for Health Statistics (NCHS), Underlying Cause of Death 1999-2017 on CDC WONDER Online Database, released 2018. Data are compiled from data provided by the 57 vital statistics jurisdictions through the Vital Statistics Cooperative Program.
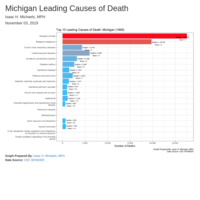
Top 15 Leading Causes of Death, Michigan (1999-2017)
Animated graph showing the top 15 leading causes of death among Michigan residents, by year, during 1999-2017. Graph is prepared by: Isaac H. Michaels, MPH. Data source is CDC WONDER: United States Department of Health and Human Services (US DHHS), Centers for Disease Control and Prevention (CDC), National Center for Health Statistics (NCHS), Underlying Cause of Death 1999-2017 on CDC WONDER Online Database, released 2018. Data are compiled from data provided by the 57 vital statistics jurisdictions through the Vital Statistics Cooperative Program.
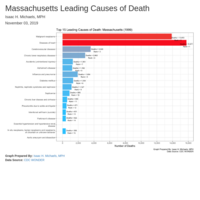
Top 15 Leading Causes of Death, Massachusetts (1999-2017)
Animated graph showing the top 15 leading causes of death among Massachusetts residents, by year, during 1999-2017. Graph is prepared by: Isaac H. Michaels, MPH. Data source is CDC WONDER: United States Department of Health and Human Services (US DHHS), Centers for Disease Control and Prevention (CDC), National Center for Health Statistics (NCHS), Underlying Cause of Death 1999-2017 on CDC WONDER Online Database, released 2018. Data are compiled from data provided by the 57 vital statistics jurisdictions through the Vital Statistics Cooperative Program.
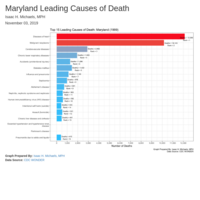
Top 15 Leading Causes of Death, Maryland (1999-2017)
Animated graph showing the top 15 leading causes of death among Maryland residents, by year, during 1999-2017. Graph is prepared by: Isaac H. Michaels, MPH. Data source is CDC WONDER: United States Department of Health and Human Services (US DHHS), Centers for Disease Control and Prevention (CDC), National Center for Health Statistics (NCHS), Underlying Cause of Death 1999-2017 on CDC WONDER Online Database, released 2018. Data are compiled from data provided by the 57 vital statistics jurisdictions through the Vital Statistics Cooperative Program.
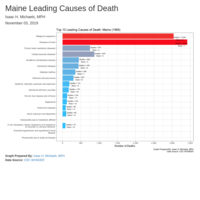
Top 15 Leading Causes of Death, Maine (1999-2017)
Animated graph showing the top 15 leading causes of death among Maine residents, by year, during 1999-2017. Graph is prepared by: Isaac H. Michaels, MPH. Data source is CDC WONDER: United States Department of Health and Human Services (US DHHS), Centers for Disease Control and Prevention (CDC), National Center for Health Statistics (NCHS), Underlying Cause of Death 1999-2017 on CDC WONDER Online Database, released 2018. Data are compiled from data provided by the 57 vital statistics jurisdictions through the Vital Statistics Cooperative Program.

Top 15 Leading Causes of Death, Louisiana (1999-2017)
Animated graph showing the top 15 leading causes of death among Louisiana residents, by year, during 1999-2017. Graph is prepared by: Isaac H. Michaels, MPH. Data source is CDC WONDER: United States Department of Health and Human Services (US DHHS), Centers for Disease Control and Prevention (CDC), National Center for Health Statistics (NCHS), Underlying Cause of Death 1999-2017 on CDC WONDER Online Database, released 2018. Data are compiled from data provided by the 57 vital statistics jurisdictions through the Vital Statistics Cooperative Program.
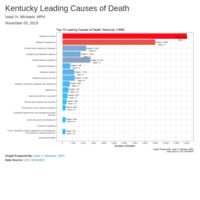
Top 15 Leading Causes of Death, Kentucky (1999-2017)
Animated graph showing the top 15 leading causes of death among Kentucky residents, by year, during 1999-2017. Graph is prepared by: Isaac H. Michaels, MPH. Data source is CDC WONDER: United States Department of Health and Human Services (US DHHS), Centers for Disease Control and Prevention (CDC), National Center for Health Statistics (NCHS), Underlying Cause of Death 1999-2017 on CDC WONDER Online Database, released 2018. Data are compiled from data provided by the 57 vital statistics jurisdictions through the Vital Statistics Cooperative Program.

Top 15 Leading Causes of Death, Kansas (1999-2017)
Animated graph showing the top 15 leading causes of death among Kansas residents, by year, during 1999-2017. Graph is prepared by: Isaac H. Michaels, MPH. Data source is CDC WONDER: United States Department of Health and Human Services (US DHHS), Centers for Disease Control and Prevention (CDC), National Center for Health Statistics (NCHS), Underlying Cause of Death 1999-2017 on CDC WONDER Online Database, released 2018. Data are compiled from data provided by the 57 vital statistics jurisdictions through the Vital Statistics Cooperative Program.
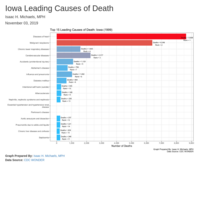
Top 15 Leading Causes of Death, Iowa (1999-2017)
Animated graph showing the top 15 leading causes of death among Iowa residents, by year, during 1999-2017. Graph is prepared by: Isaac H. Michaels, MPH. Data source is CDC WONDER: United States Department of Health and Human Services (US DHHS), Centers for Disease Control and Prevention (CDC), National Center for Health Statistics (NCHS), Underlying Cause of Death 1999-2017 on CDC WONDER Online Database, released 2018. Data are compiled from data provided by the 57 vital statistics jurisdictions through the Vital Statistics Cooperative Program.

Top 15 Leading Causes of Death, Indiana (1999-2017)
Animated graph showing the top 15 leading causes of death among Indiana residents, by year, during 1999-2017. Graph is prepared by: Isaac H. Michaels, MPH. Data source is CDC WONDER: United States Department of Health and Human Services (US DHHS), Centers for Disease Control and Prevention (CDC), National Center for Health Statistics (NCHS), Underlying Cause of Death 1999-2017 on CDC WONDER Online Database, released 2018. Data are compiled from data provided by the 57 vital statistics jurisdictions through the Vital Statistics Cooperative Program.
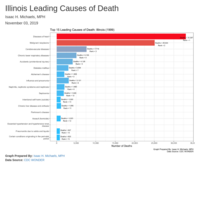
Top 15 Leading Causes of Death, Illinois (1999-2017)
Animated graph showing the top 15 leading causes of death among Illinois residents, by year, during 1999-2017. Graph is prepared by: Isaac H. Michaels, MPH. Data source is CDC WONDER: United States Department of Health and Human Services (US DHHS), Centers for Disease Control and Prevention (CDC), National Center for Health Statistics (NCHS), Underlying Cause of Death 1999-2017 on CDC WONDER Online Database, released 2018. Data are compiled from data provided by the 57 vital statistics jurisdictions through the Vital Statistics Cooperative Program.
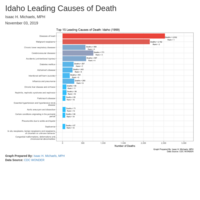
Top 15 Leading Causes of Death, Idaho (1999-2017)
Animated graph showing the top 15 leading causes of death among Idaho residents, by year, during 1999-2017. Graph is prepared by: Isaac H. Michaels, MPH. Data source is CDC WONDER: United States Department of Health and Human Services (US DHHS), Centers for Disease Control and Prevention (CDC), National Center for Health Statistics (NCHS), Underlying Cause of Death 1999-2017 on CDC WONDER Online Database, released 2018. Data are compiled from data provided by the 57 vital statistics jurisdictions through the Vital Statistics Cooperative Program.
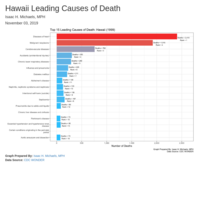
Top 15 Leading Causes of Death, Hawaii (1999-2017)
Animated graph showing the top 15 leading causes of death among Hawaii residents, by year, during 1999-2017. Graph is prepared by: Isaac H. Michaels, MPH. Data source is CDC WONDER: United States Department of Health and Human Services (US DHHS), Centers for Disease Control and Prevention (CDC), National Center for Health Statistics (NCHS), Underlying Cause of Death 1999-2017 on CDC WONDER Online Database, released 2018. Data are compiled from data provided by the 57 vital statistics jurisdictions through the Vital Statistics Cooperative Program.
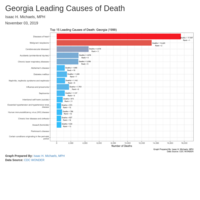
Top 15 Leading Causes of Death, Georgia (1999-2017)
Animated graph showing the top 15 leading causes of death among Georgia residents, by year, during 1999-2017. Graph is prepared by: Isaac H. Michaels, MPH. Data source is CDC WONDER: United States Department of Health and Human Services (US DHHS), Centers for Disease Control and Prevention (CDC), National Center for Health Statistics (NCHS), Underlying Cause of Death 1999-2017 on CDC WONDER Online Database, released 2018. Data are compiled from data provided by the 57 vital statistics jurisdictions through the Vital Statistics Cooperative Program.
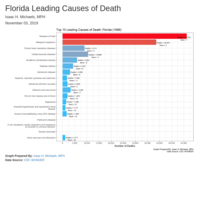
Top 15 Leading Causes of Death, Florida (1999-2017)
Animated graph showing the top 15 leading causes of death among Florida residents, by year, during 1999-2017. Graph is prepared by: Isaac H. Michaels, MPH. Data source is CDC WONDER: United States Department of Health and Human Services (US DHHS), Centers for Disease Control and Prevention (CDC), National Center for Health Statistics (NCHS), Underlying Cause of Death 1999-2017 on CDC WONDER Online Database, released 2018. Data are compiled from data provided by the 57 vital statistics jurisdictions through the Vital Statistics Cooperative Program.

Top 15 Leading Causes of Death, District of Columbia (1999-2017)
Animated graph showing the top 15 leading causes of death among Washington D.C. residents, by year, during 1999-2017. Graph is prepared by: Isaac H. Michaels, MPH. Data source is CDC WONDER: United States Department of Health and Human Services (US DHHS), Centers for Disease Control and Prevention (CDC), National Center for Health Statistics (NCHS), Underlying Cause of Death 1999-2017 on CDC WONDER Online Database, released 2018. Data are compiled from data provided by the 57 vital statistics jurisdictions through the Vital Statistics Cooperative Program.
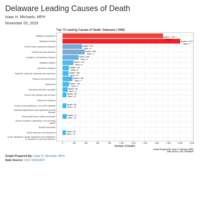
Top 15 Leading Causes of Death, Delaware (1999-2017)
Animated graph showing the top 15 leading causes of death among Delaware residents, by year, during 1999-2017. Graph is prepared by: Isaac H. Michaels, MPH. Data source is CDC WONDER: United States Department of Health and Human Services (US DHHS), Centers for Disease Control and Prevention (CDC), National Center for Health Statistics (NCHS), Underlying Cause of Death 1999-2017 on CDC WONDER Online Database, released 2018. Data are compiled from data provided by the 57 vital statistics jurisdictions through the Vital Statistics Cooperative Program.

Top 15 Leading Causes of Death, Connecticut (1999-2017)
Animated graph showing the top 15 leading causes of death among Connecticut residents, by year, during 1999-2017. Graph is prepared by: Isaac H. Michaels, MPH. Data source is CDC WONDER: United States Department of Health and Human Services (US DHHS), Centers for Disease Control and Prevention (CDC), National Center for Health Statistics (NCHS), Underlying Cause of Death 1999-2017 on CDC WONDER Online Database, released 2018. Data are compiled from data provided by the 57 vital statistics jurisdictions through the Vital Statistics Cooperative Program.
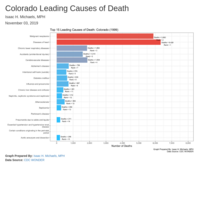
Top 15 Leading Causes of Death, Colorado (1999-2017)
Animated graph showing the top 15 leading causes of death among Colorado residents, by year, during 1999-2017. Graph is prepared by: Isaac H. Michaels, MPH. Data source is CDC WONDER: United States Department of Health and Human Services (US DHHS), Centers for Disease Control and Prevention (CDC), National Center for Health Statistics (NCHS), Underlying Cause of Death 1999-2017 on CDC WONDER Online Database, released 2018. Data are compiled from data provided by the 57 vital statistics jurisdictions through the Vital Statistics Cooperative Program.
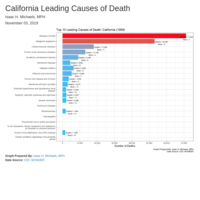
Top 15 Leading Causes of Death, California (1999-2017)
Animated graph showing the top 15 leading causes of death among California residents, by year, during 1999-2017. Graph is prepared by: Isaac H. Michaels, MPH. Data source is CDC WONDER: United States Department of Health and Human Services (US DHHS), Centers for Disease Control and Prevention (CDC), National Center for Health Statistics (NCHS), Underlying Cause of Death 1999-2017 on CDC WONDER Online Database, released 2018. Data are compiled from data provided by the 57 vital statistics jurisdictions through the Vital Statistics Cooperative Program.
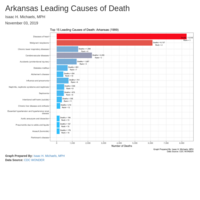
Top 15 Leading Causes of Death, Arkansas (1999-2017)
Animated graph showing the top 15 leading causes of death among Arkansas residents, by year, during 1999-2017. Graph is prepared by: Isaac H. Michaels, MPH. Data source is CDC WONDER: United States Department of Health and Human Services (US DHHS), Centers for Disease Control and Prevention (CDC), National Center for Health Statistics (NCHS), Underlying Cause of Death 1999-2017 on CDC WONDER Online Database, released 2018. Data are compiled from data provided by the 57 vital statistics jurisdictions through the Vital Statistics Cooperative Program.
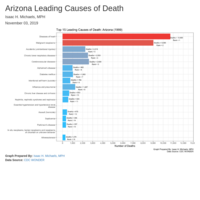
Top 15 Leading Causes of Death, Arizona (1999-2017)
Animated graph showing the top 15 leading causes of death among Arizona residents, by year, during 1999-2017. Graph is prepared by: Isaac H. Michaels, MPH. Data source is CDC WONDER: United States Department of Health and Human Services (US DHHS), Centers for Disease Control and Prevention (CDC), National Center for Health Statistics (NCHS), Underlying Cause of Death 1999-2017 on CDC WONDER Online Database, released 2018. Data are compiled from data provided by the 57 vital statistics jurisdictions through the Vital Statistics Cooperative Program.
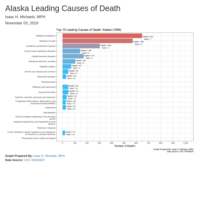
Top 15 Leading Causes of Death, Alaska (1999-2017)
Animated graph showing the top 15 leading causes of death among Alaska residents, by year, during 1999-2017. Graph is prepared by: Isaac H. Michaels, MPH. Data source is CDC WONDER: United States Department of Health and Human Services (US DHHS), Centers for Disease Control and Prevention (CDC), National Center for Health Statistics (NCHS), Underlying Cause of Death 1999-2017 on CDC WONDER Online Database, released 2018. Data are compiled from data provided by the 57 vital statistics jurisdictions through the Vital Statistics Cooperative Program.

Top 15 Leading Causes of Death, Alabama (1999-2017)
Animated graph showing the top 15 leading causes of death among Alabama residents, by year, during 1999-2017. Graph is prepared by: Isaac H. Michaels, MPH. Data source is CDC WONDER: United States Department of Health and Human Services (US DHHS), Centers for Disease Control and Prevention (CDC), National Center for Health Statistics (NCHS), Underlying Cause of Death 1999-2017 on CDC WONDER Online Database, released 2018. Data are compiled from data provided by the 57 vital statistics jurisdictions through the Vital Statistics Cooperative Program.
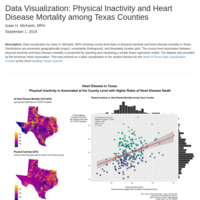
Data Visualization: Physical Inactivity and Heart Disease Mortality among Texas Counties
Data visualization by Isaac H. Michaels, MPH showing county-level data on physical inactivity and heart disease mortality in Texas. Distributions are presented geographically (maps), univariately (histograms), and bivariately (scatter plot). The county-level association between physical inactivity and heart disease mortality is presented by reporting and visualizing a simple linear regression model. The dataset was provided by the American Heart Association. This was entered as a static visualization in the student division for the Heart of Texas Data Visualization Contest at the 2019 Healthier Texas Summit.
NYC 311 Open Data Quarterly Summary: 2019_Q3
Narrative, graphic, and tabular summaries of open data on NYC 311 service requests created during 2019 Q3.
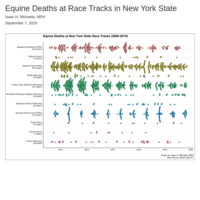
Equine Deaths at New York State Race Tracks (2009-2019)
Graph of equine deaths at race tracks in New York State, by track, during 2009-2019. Data source: Open Data NY.
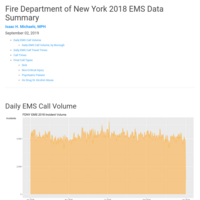
Fire Department of New York 2018 EMS Data Summary
Graphic and tabular summaries of open data on all FDNY EMS responses that occurred in 2018. Data source: NYC Open Data.

NYC 311 Open Data Quarterly Summary: 2019_Q2
Narrative, graphic, and tabular summaries of open data on NYC 311 service requests created during 2019 Q2.
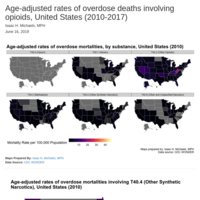
Age-adjusted rates of overdose deaths involving opioids, United States (2010-2017)
Animated U.S. choropleth maps showing age-adjusted mortality rate per 100,000 population for overdose mortalities involving opioids, by state, during 1999-2017. The maps are prepared by: Isaac H. Michaels, MPH. Data source is CDC WONDER: United States Department of Health and Human Services (US DHHS), Centers for Disease Control and Prevention (CDC), National Center for Health Statistics (NCHS), Multiple Cause of Death 1999-2017 on CDC WONDER Online Database, released 2018. Data are compiled from data provided by the 57 vital statistics jurisdictions through the Vital Statistics Cooperative Program.
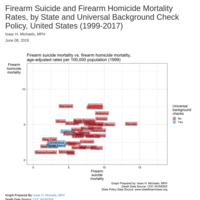
Firearm Suicide and Firearm Homicide Mortality Rates, by State and Universal Background Check Policy, United States (1999-2017)
Animated graph showing age-adjusted mortality rate per 100,000 population for firearm suicides vs. firearm homicides, by state, during 1999-2017. The labels are shaded according to whether the respective state, during the respective year, had a universal background check law in place for firearm purchases. Graph is prepared by: Isaac H. Michaels, MPH. Mortality data source is CDC WONDER: United States Department of Health and Human Services (US DHHS), Centers for Disease Control and Prevention (CDC), National Center for Health Statistics (NCHS), Multiple Cause of Death 1999-2017 on CDC WONDER Online Database, released 2018. Data are compiled from data provided by the 57 vital statistics jurisdictions through the Vital Statistics Cooperative Program. State gun policy data source is www.statefirearmlaws.org.
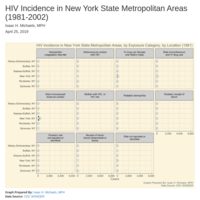
HIV Incidence in New York State Metropolitan Areas, by Exposure Category, by Location (1981-2002)
Animated horizontal bar plots of HIV incidence in New York State metropolitan areas, by exposure category, by location, during 1981-2002. Data Source: CDC WONDER.

Visualization of New York State Prevention Quality Indicators: PQI_92
Animated plots of Prevention Quality Chronic Composite, by patient county, in New York State during 2009-2014. Data Source: Health Data NY.

Visualization of New York State Prevention Quality Indicators: PQI_91
Animated plots of Prevention Quality Acute Composite, by patient county, in New York State during 2009-2014. Data Source: Health Data NY.

Visualization of New York State Prevention Quality Indicators: PQI_90
Animated plots of Prevention Quality Overall Composite, by patient county, in New York State during 2009-2014. Data Source: Health Data NY.

Visualization of New York State Prevention Quality Indicators: PQI_16
Animated plots of Lower-Extremity Amputation among Patients with Diabetes, by patient county, in New York State during 2009-2014. Data Source: Health Data NY.
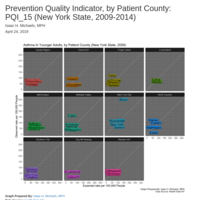
Visualization of New York State Prevention Quality Indicators: PQI_15
Animated plots of Asthma in Younger Adults, by patient county, in New York State during 2009-2014. Data Source: Health Data NY.

Visualization of New York State Prevention Quality Indicators: PQI_14
Animated plots of Uncontrolled Diabetes, by patient county, in New York State during 2009-2014. Data Source: Health Data NY.

Visualization of New York State Prevention Quality Indicators: PQI_13
Animated plots of Angina Without Procedure, by patient county, in New York State during 2009-2014. Data Source: Health Data NY.

Visualization of New York State Prevention Quality Indicators: PQI_12
Animated plots of Urinary Tract Infection, by patient county, in New York State during 2009-2014. Data Source: Health Data NY.

Visualization of New York State Prevention Quality Indicators: PQI_11
Animated plots of Bacterial Pneumonia, by patient county, in New York State during 2009-2014. Data Source: Health Data NY.
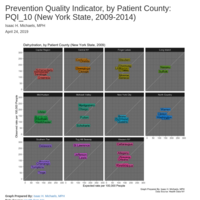
Visualization of New York State Prevention Quality Indicators: PQI_10
Animated plots of Dehydration, by patient county, in New York State during 2009-2014. Data Source: Health Data NY.
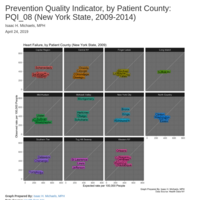
Visualization of New York State Prevention Quality Indicators: PQI_08
Animated plots of Heart Failure, by patient county, in New York State during 2009-2014. Data Source: Health Data NY.

Visualization of New York State Prevention Quality Indicators: PQI_07
Animated plots of Hypertension, by patient county, in New York State during 2009-2014. Data Source: Health Data NY.
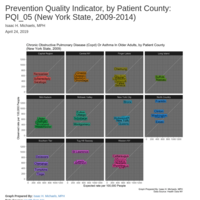
Visualization of New York State Prevention Quality Indicators: PQI_05
Animated plots of Chronic Obstructive Pulmonary Disease (COPD) or Asthma in Older Adults, by patient county, in New York State during 2009-2014. Data Source: Health Data NY.
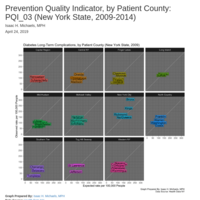
Visualization of New York State Prevention Quality Indicators: PQI_03
Animated plots of Diabetes Long-term Complications, by patient county, in New York State during 2009-2014. Data Source: Health Data NY.

Visualization of New York State Prevention Quality Indicators: PQI_01
Animated plots of Diabetes Short-term Complications, by patient county, in New York State during 2009-2014. Data Source: Health Data NY.
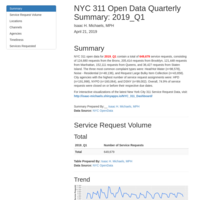
NYC 311 Open Data Quarterly Summary: 2019_Q1
Narrative, graphic, and tabular summaries of open data on NYC 311 service requests created during 2019 Q1.
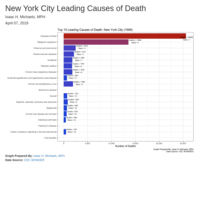
Top 15 Leading Causes of Death, New York City (1999-2017)
Animated graph showing the top 15 leading causes of death among New York City residents, by year, during 1999-2017.
Graph is prepared by:
Isaac H. Michaels, MPH.
Data source is CDC WONDER:
United States Department of Health and Human Services (US DHHS),
Centers for Disease Control and Prevention (CDC),
National Center for Health Statistics (NCHS),
Multiple Cause of Death 1999-2017 on CDC WONDER Online Database, released 2018. Data are compiled from data provided by the 57 vital statistics jurisdictions through the Vital Statistics Cooperative Program.
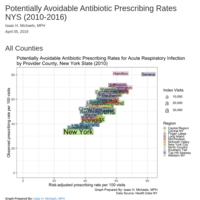
Rates of Potentially Avoidable Antibiotic Prescribing, New York State (2010-2016)
Animated and static plots of potentially avoidable antibiotic prescribing rates for acute respiratory infection. The data reflect Medicaid-enrolled adults ages 18-64 in New York State during 2010-2016, and are stratified by county and year. Data Source: Health Data NY.

NYC 311 Open Data Quarterly Summary: 2018_Q4
Narrative, graphic, and tabular summaries of open data on NYC 311 service requests created during 2018 Q4.

NYC 311 Open Data Quarterly Summary: 2018_Q3
Narrative, graphic, and tabular summaries of open data on NYC 311 service requests created during 2018 Q3.

NYC 311 Open Data Quarterly Summary: 2018_Q2
Narrative, graphic, and tabular summaries of open data on NYC 311 service requests created during 2018 Q2.

NYC 311 Open Data Quarterly Summary: 2018_Q1
Narrative, graphic, and tabular summaries of open data on NYC 311 service requests created during 2018 Q1.

NYC 311 Open Data Quarterly Summary: 2017_Q4
Narrative, graphic, and tabular summaries of open data on NYC 311 service requests created during 2017 Q4.

NYC 311 Open Data Quarterly Summary: 2017_Q3
Narrative, graphic, and tabular summaries of open data on NYC 311 service requests created during 2017 Q3.

NYC 311 Open Data Quarterly Summary: 2017_Q2
Narrative, graphic, and tabular summaries of open data on NYC 311 service requests created during 2017 Q2.

NYC 311 Open Data Quarterly Summary: 2017_Q1
Narrative, graphic, and tabular summaries of open data on NYC 311 service requests created during 2017 Q1.

NYC 311 Open Data Quarterly Summary: 2016_Q4
Narrative, graphic, and tabular summaries of open data on NYC 311 service requests created during 2016 Q4.

NYC 311 Open Data Quarterly Summary: 2016_Q3
Narrative, graphic, and tabular summaries of open data on NYC 311 service requests created during 2016 Q3.

NYC 311 Open Data Quarterly Summary: 2016_Q2
Narrative, graphic, and tabular summaries of open data on NYC 311 service requests created during 2016 Q2.

NYC 311 Open Data Quarterly Summary: 2016_Q1
Narrative, graphic, and tabular summaries of open data on NYC 311 service requests created during 2016 Q1.

NYC 311 Open Data Quarterly Summary: 2015_Q4
Narrative, graphic, and tabular summaries of open data on NYC 311 service requests created during 2015 Q4.
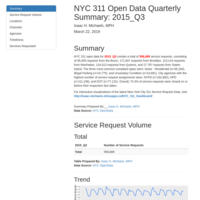
NYC 311 Open Data Quarterly Summary: 2015_Q3
Narrative, graphic, and tabular summaries of open data on NYC 311 service requests created during 2015 Q3.

NYC 311 Open Data Quarterly Summary: 2015_Q2
Narrative, graphic, and tabular summaries of open data on NYC 311 service requests created during 2015 Q2.

NYC 311 Open Data Quarterly Summary: 2015_Q1
Narrative, graphic, and tabular summaries of open data on NYC 311 service requests created during 2015 Q1.

NYC 311 Open Data Quarterly Summary: 2014_Q4
Narrative, graphic, and tabular summaries of open data on NYC 311 service requests created during 2014 Q4.

NYC 311 Open Data Quarterly Summary: 2014_Q3
Narrative, graphic, and tabular summaries of open data on NYC 311 service requests created during 2014 Q3.

NYC 311 Open Data Quarterly Summary: 2014_Q2
Narrative, graphic, and tabular summaries of open data on NYC 311 service requests created during 2014 Q2.

NYC 311 Open Data Quarterly Summary: 2014_Q1
Narrative, graphic, and tabular summaries of open data on NYC 311 service requests created during 2014 Q1.

NYC 311 Open Data Quarterly Summary: 2013_Q4
Narrative, graphic, and tabular summaries of open data on NYC 311 service requests created during 2013 Q4.
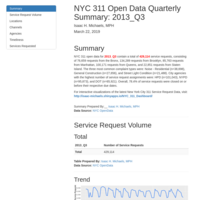
NYC 311 Open Data Quarterly Summary: 2013_Q3
Narrative, graphic, and tabular summaries of open data on NYC 311 service requests created during 2013 Q3.

NYC 311 Open Data Quarterly Summary: 2013_Q2
Narrative, graphic, and tabular summaries of open data on NYC 311 service requests created during 2013 Q2.

NYC 311 Open Data Quarterly Summary: 2013_Q1
Narrative, graphic, and tabular summaries of open data on NYC 311 service requests created during 2013 Q1.

NYC 311 Open Data Quarterly Summary: 2012_Q4
Narrative, graphic, and tabular summaries of open data on NYC 311 service requests created during 2012 Q4.
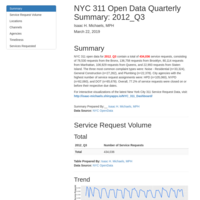
NYC 311 Open Data Quarterly Summary: 2012_Q3
Narrative, graphic, and tabular summaries of open data on NYC 311 service requests created during 2012 Q3.

NYC 311 Open Data Quarterly Summary: 2012_Q2
Narrative, graphic, and tabular summaries of open data on NYC 311 service requests created during 2012 Q2.
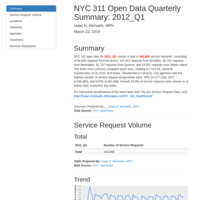
NYC 311 Open Data Quarterly Summary: 2012_Q1
Narrative, graphic, and tabular summaries of open data on NYC 311 service requests created during 2012 Q1.

NYC 311 Open Data Quarterly Summary: 2011_Q4
Narrative, graphic, and tabular summaries of open data on NYC 311 service requests created during 2011 Q4.

NYC 311 Open Data Quarterly Summary: 2011_Q3
Narrative, graphic, and tabular summaries of open data on NYC 311 service requests created during 2011 Q3.
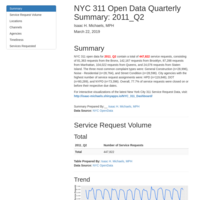
NYC 311 Open Data Quarterly Summary: 2011_Q2
Narrative, graphic, and tabular summaries of open data on NYC 311 service requests created during 2011 Q2.

NYC 311 Open Data Quarterly Summary: 2011_Q1
Narrative, graphic, and tabular summaries of open data on NYC 311 service requests created during 2011 Q1.

NYC 311 Open Data Quarterly Summary: 2010_Q4
Narrative, graphic, and tabular summaries of open data on NYC 311 service requests created during 2010 Q4.

NYC 311 Open Data Quarterly Summary: 2010_Q3
Narrative, graphic, and tabular summaries of open data on NYC 311 service requests created during 2010 Q3.
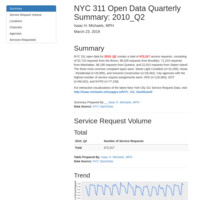
NYC 311 Open Data Quarterly Summary: 2010_Q2
Narrative, graphic, and tabular summaries of open data on NYC 311 service requests created during 2010 Q2.

NYC 311 Open Data Quarterly Summary: 2010_Q1
Narrative, graphic, and tabular summaries of open data on NYC 311 service requests created during 2010 Q1.
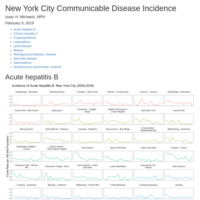
New York City Communicable Disease Incidence
Trend graphs of crude incidence rates for ten communicable diseases in New York City, by neighborhood, by year.