
jamescecon
James Cockett
Recently Published


Mortality rate by LA - TEST
Age-standardised mortality rate by 2023 LA
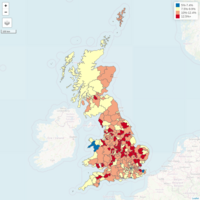
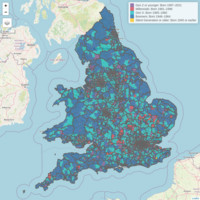
Jobs in demand in transition to a green economy (PCAN)
Data based on Place-based Climate Action Network (PCAN) Just Transition Jobs Tracker using estimates by local authority district from 2019. This map shows-
Jobs in demand: These are existing jobs that are expected to be in high demand due to their important role in the net-zero economy. These include specialised positions in the green economy, such as wind turbine installers, but also the skills and expertise of welders, builders and engineers already working to build the infrastructure of a green economy.
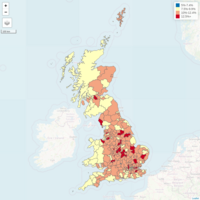
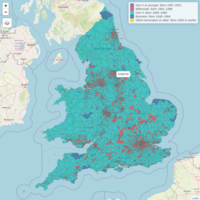
Jobs requiring upskilling in transition to a green economy (PCAN)
Data based on Place-based Climate Action Network (PCAN) Just Transition Jobs Tracker using estimates by local authority district from 2019. This map shows-
Jobs requiring upskilling: These are existing jobs that require significant changes in skills and knowledge. These include specialised jobs in the manufacturing and extractive sectors, such as petroleum engineers and heavy equipment operators, whose skills need to be adapted to a net-zero economy.
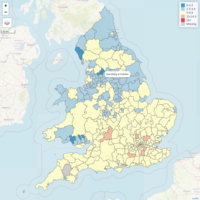
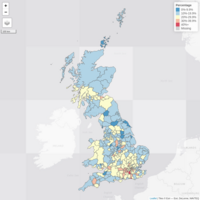
Housing affordability (2003)
Ratio of median house price to median gross annual workplace-based earnings by local authority district, England and Wales, 2003. Sources: Office for National Statistics, Land Registry, Office for National Statistics - Annual Survey of Hours and Earnings
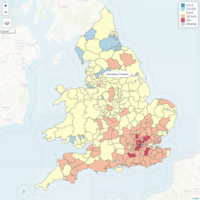
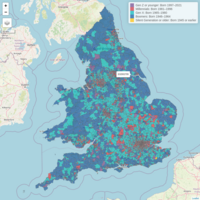
Housing affordability (2022)
Ratio of median house price to median gross annual workplace-based earnings by local authority district, England and Wales, 2022. Sources: Office for National Statistics, Land Registry, Office for National Statistics - Annual Survey of Hours and Earnings
Working from home by local authority
This map shows the proportion of residents who have own home as their main place of work from the Annual Population Survey October 2021- September 2022.
Modal age by neighbourhood (parliamentary boundaries overlay)
This interactive map shows the median age by middle-layer super output area (MSOA) from the 2021 Census of England and Wales, with parliamentary boundaries overlaid.
Median age by neighbourhood
This interactive map shows the median age by middle-layer super output area (MSOA) from the 2021 Census of England and Wales.
Modal age by neighbourhood
This interactive map shows the median age by middle-layer super output area (MSOA) from the 2021 Census of England and Wales.
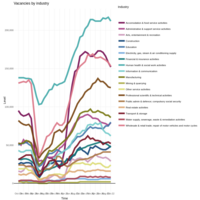
Vacancies by industry
Analysis of ONS Vacancy survey data on the three years to October 2022.
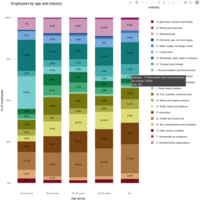
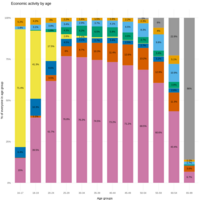
Employees by age and industry
Analysis of employees by age and industry from the Jul-Sep 2022 Labour Force Survey.
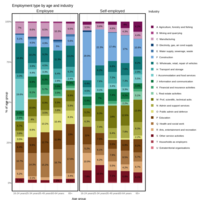
Employment type by age and industry
Employees and self-employed broken down by age and industry using the July-September 2022 Labour Force Survey.
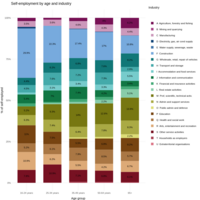
Self-employment by age and industry
Analysis of self-employment by age and industry from the Jul-Sep 2022 Labour Force Survey.
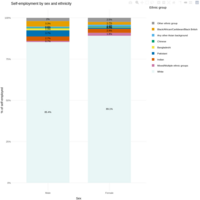
Self-employment by sex and ethnicity
Analysis using LFS Jul-Sep 2022, using previous version of ploty package (4.9.4.1).
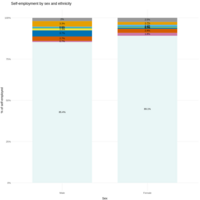
Self-employment by gender and ethncity
Interactive chart showing the distribution of self-employment by gender, broken down by ethnicity using LFS July-September 2022 data.