
jgleeson
James Gleeson
Recently Published
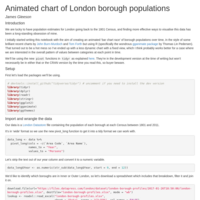
Animated population of London boroughs, 1801-2011
Using gganimate to create an animated bar chart of London borough populations between 1801 and 2011
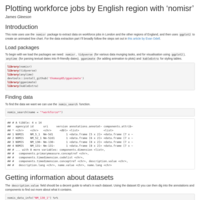
Analysing data on workforce jobs by English region with 'nomisr'
This note uses use the `nomisr` package to extract data on workforce jobs in London and the other regions of England, and then uses `ggplot2` to create an animated line chart.
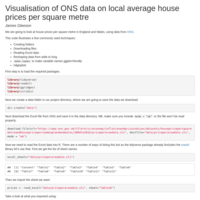
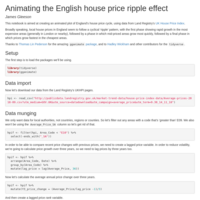
Visualisation of ONS data on local average house prices per square metre
An analysis of house prices per square metre in England and Wales, using data from ONS - as featured in the Greater London Authority's 2018 Housing in London report
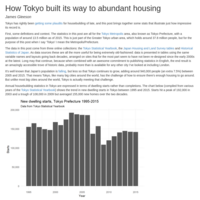
How Tokyo built its way to housing abundance
Analysis of data on housing supply in Tokyo