Recently Published
Using `dogesr` to work with Venetian doges family types
An introduction to marriage tactics in the republic of Venice through the use of the dogesR CRAN package.
Using dogesr to work with Venetian doges tenures
How to use the `dogesr` CRAN package, that includes data on Venetian doges (or presidents of the republic), to work out how long they stayed in power and if there was some change along the eleven centuries the Republic lasted.
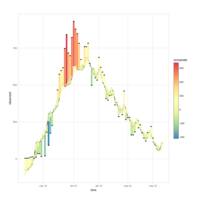
Descomposición en tendencia + estacionalidad de la serie de fallecimientos en España
Uso de anomalize para descomponer la serie temporal de fallecimientos (extraída de Datadista) en tendencia + estacionalidad + resto. La línea muestra tendencia + estacionalidad, y la barra gruesa es el resto, con un color relativo a su valor.
Código en https://github.com/JJ/covid-reports
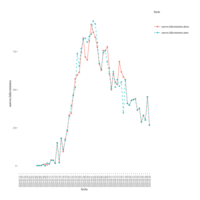
Diferencia entre serie de nuevos fallecimientos diarios publicados por el ministerio de Sanidad español hasta el 30 de abril y la actual
El 1 de mayo el ministerio de Sanidad español publicó de nuevo todas las series de fallecimientos, altas, contagios y otros datos; en esta serie hay diferencias considerables con respecto a la serie anterior. Usando los datos del Datadista, calculamos la diferencia entre los nuevos fallecimientos usando la serie anterior (turquesa) y la actual (rojo)
Finding the best predictor for the number of deceases in the COVID-19 pandemic in Spain
Finding good predictors for the number of deceases, among other things, allows the public to assess in which phase of the pandemic we really are now. In this report we try to fit different series of ICU and hospital check-ins to deceases in Spain, and try to come up with a good predictor for the number of deceases today, with the main objective of finding out, on the spot, if we're past the peak number of deceases or not.
Encontrando correlaciones en los datos diarios de COVID-19 en España
Los datos diarios son más adecuados para tratar de predecir el estado futuro de casos, hospitalizaciones y decesos. En este informe, usando los datos del Datadista, tratamos de inferir la dinámica de los casos del COVID19 en España usando correlaciones cruzadas y autocorrelaciones de las diferentes series.
Past the peak: predicting peak COVID-19 and the end of the lockdown in Spain
The Spanish Government declared a national emergency on March 14th, 2020 due to the coronavirus outbreak. Three weeks later, there's no end in sight. The scarcity of hard data makes it hard to predict when the peak will be reached, and when it might end. In this report we will try and estimate the peak combining prediction based on different time series and the logistic growth curve.
Spain and Italy time series correlation
Different countries attacked the COVID-19 outbreak in different ways; however, the results seem to have some correlation, even more so if the countries are similar geographically, politically and culturally. In this report we investigate correlations between the time series of infection and deceases in Spain and Italy, and try to come up with a lag between them, so that we can infer something on the Spanish situation, which seems to go behind.
Encontrando correlaciones en los datos de COVID-19 en España
Más allá de las series, las correlaciones entre datos y diferencias de datos diarios permiten establecer posibles relaciones causa-efecto, y predecir a corto plazo una variable a partir de otras.
Evolution and dynamics of case fatality rate in the COVID19 pandemia
Different countries have different policies regarding testing of COVID-19 infections and reporting of deceases due to that infection. These policies show themselves in the evolution of the case fatality ratio, or relation between total number of infected people and reported deceases. Its dynamics and statistical features will allow us to assess these policies mainly regarding under-testing or under-reporting of fatalities.
Evolución casos COVID19 en España en unos gráficos
Documento en RMarkdown que presenta en unos gráficos los datos publicados por el Ministerio de Sanidad a través del Datadista, incluyendo diferencias con días anteriores, también suavizadas para ofrecer un panorama más completo que no incluya retrasos en los informes o diferentes períodos.
Estimating the infection fatality rate by using time series correlations
In this paper we try offer a methodology to estimate the infection fatality rate using rolling sums of cases and deaths, as well as correlation between these to estimate the time from detection to outcome. By this methodology, the South Korea infection fatality rate is found to be around 0.5%. Trying to apply the same method to Germany leads to conflicting results, which might be a failure in the methodology or in the reporting of cases by this country.
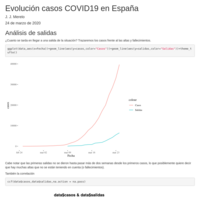
Análisis de datos del COVID-19 en España
Análisis de nuevos casos, altas y fallecimientos, junto con gráficas de correlación entre el número de casos, fallecimientos y altas.
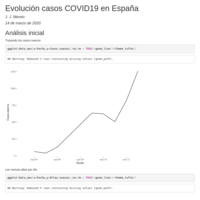
Nuevos casos, fallecimientos y altas de coronavirus en España hasta 14 de marzo
Usando los datos del repositorio de Datadista, nuevos casos de coronavirus en España desde el principio. Se puede consultar el repositorio en https://github.com/datadista/datasets. Los datos y el script que los genera tienen licencia libre.
Perl 6 documentation score in the June 2018 survey
An analysis of how Perl 6 documentation has been scored in the first Perl 6 developer survey, cross checking it against other responses.
Estadísticas 9ª Jornadas R Hispano
Informe preliminar sobre tecnologías y género de los asistentes a las 9ª jornadas de R Hispano, celebradas en Granada el 16 y 17 de noviembre de 2017.
Complex social graphs in repositories
here is no single *natural* way of analyzing the graph created by the collaborative work of a team of software developers as reflected in the log of that repository. In this paper we will analyze several graphs created by this work, considering author or files the nodes in what is actually a bipartite network. We will try to find out which network better represents the complex nature of the technosocial system.
Copérnico famoso por un día
Un análisis de las visitas a la página de Nicolás Copérnico en la Wikipedia española
Desigualdad y sorpresa en las elecciones españolas
La distribución de votos entre partidos cambia de elección a elección, pero a priori, a pesar de interpretaciones como el "tsunami bipartidista" y "las mareas del cambio", es difícil saber qué tendencia sigue y cómo y con qué frecuencia se producen estos cambios. Para averiguarlo y a partir de los datos de las elecciones españolas de ámbito nacional desde 1977, hemos medido una serie de índices de desigualdad y analizado qué cambios y tendencias aparecen.
Github users in Spain: a report on geographical distribution and language use of open source developers
Measuring and ranking the free software developers in a particular geographical location is a way of knowing the existing community and also allows assessing the impact of certain policies in the dynamics of such a community. Besides, it is interesting to try and find out why there are differences from one place to the next and how these differences evolve with time. In this paper, our main interest is to measure and rank the community of free software developers in Spain and also check its geographical distribution. That is why measures are taken by province, providing a classification of provinces according to the number and type of developers present in each place. A study of the most popular languages is also made, leaving JavaScript as a clear winner.
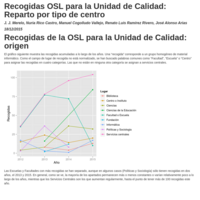
Recogidas de la OSL para la Unidad de Calidad Ambiental: evolución temporal y origen
Un informe con las recogidas llevadas a cabo por la OSL desde 2012 hasta la actualidad, disgregados por origen
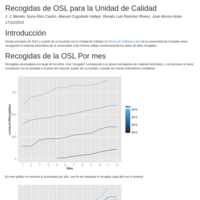
Recogidas de material informático en la UGR desde el inicio
Evolución de las recogidas de material informático gestionadas por la OSL (http://osl.ugr.es) a lo largo del tiempo.
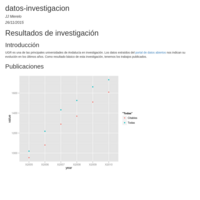
Datos de investigadores de la UGR de 2015 a 2010
Evolución del número de publicaciones de la Universidad de Granada
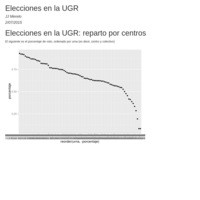
Porcentajes de votación - Elecciones en la UGR
Porcentajes de voto a cada uno de los candidatos en las elecciones a la UGR, 25 de mayo
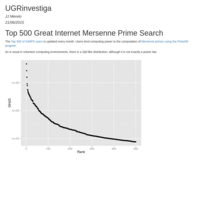
Computing power in volunteer computint experiments: The case of Mersenne Primes
A graph that plots the amount of computing power lent to the prime search experiment by users.
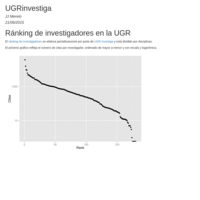
Ránking de investigadores en informática en la UGR
Un ránking en escala logarítmica de los 180 investigadores rastreados por UGR investiga
GitHub users in Spain: another update
Part of the series "GitHub users in Spain", with updated values to June 2015
GitHub users in Spain: an update
An analysis of GitHub users in Spain and how they are distributed among regions and provinces, also the reasons why some provinces might be more "productive" than others
GitHub users in Spain: an initial analysis
Measuring and ranking the free software developers in a particular geographical space is a way of knowing the existing community and also allows assessing the impact of certain policies in the dynamics of such a community. Besides, it is interesting to try and find out why there are differences from one place to the next and how these differences evolve with time.
In this paper, our main interest is to measure and rank the community of free software developers in Spain. This paper is an initial assessment, and measures differences by province, providing a classification of provinces according to the number and type of developers present in each place.