Recently Published
My First Word Cloud!
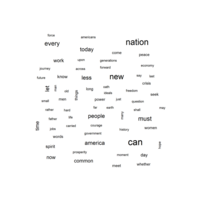
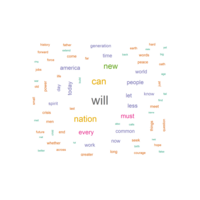
This is my word cloud created from a President Obama speech. Enjoy!
WA State with Counties Plot
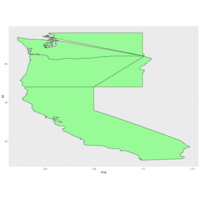
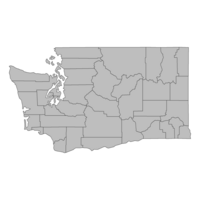
plotted a subset of States by creating a subset using R scripting with WA and its counties as my choice. Enjoy!
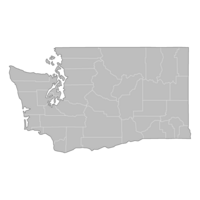
WA State with Counties Plot
plotted a subset of States by creating a subset using R scripting with WA and its counties as my choice. Enjoy!
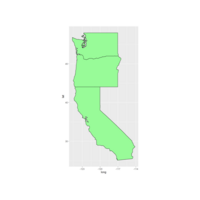
Plot a subset of State v2
Formatted the subset group with the coord_fixed() function.
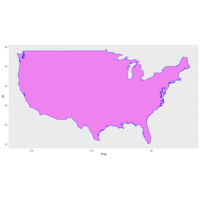
Changing Line and Fill Color v2
For a violet fill and blue outline:
> gg1 <- ggplot() + geom_polygon(data = usa, aes(x=long, y=lat, group=group), fill="violet", color="blue")+
+ coord_fixed(1.3)
> gg1
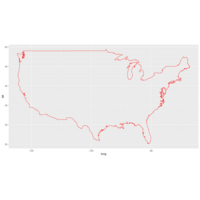
Changing Line and Fill colors
Using the additional parameters of lien and fill, the map can be further manipulated.
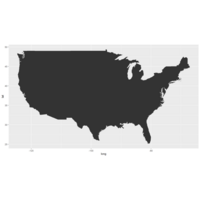
My first map
By fault, geom_polygon() draws with no line color, but with a black fill.
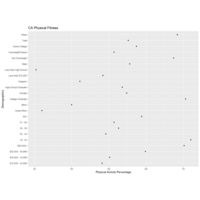
CA Physical Fitness
I wanted to find at least one alternative source of data to utilize to support your decision-making scenario. It took me a long time to find a free dataset that correlates with your scenario that I could play with and know how to utilize it. This dataset is from the 2013 California Dietary Practices Survey of Adults to which they asked a series of eight questions about their physical activity practices in the last month. The state of California borrowed the items from the Behavior Risk Factor Surveillance System. Data displayed in this table represent California adults who met the aerobic recommendation for physical activity, as defined by the 2008 U.S. Department of Health and Human Services Physical Activity Guidelines for Americans and Objectives 2.1 and 2.2 of Healthy People 2020. This data type would provide some insight into commercial gyms as to the demographics that attempt a marketing event.
Reference
HealthData.gov. (2019, August 3). California Adults Who Met Physical Activity Guidelines for Americans, 2013. Retrieved from https://healthdata.gov/dataset/california-adults-who-met-physical-activity-guidelines-americans-2013
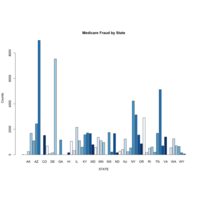
Medicare Fraud by State (as of 08/2020)
This is a bar chart using the "barplot()" function to analyze and discover some insight.
