jrpepper
Josh Pepper
Recently Published
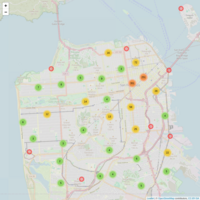
Opioid overdose hotspotting
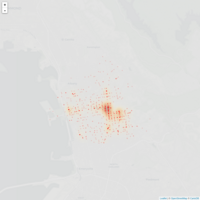
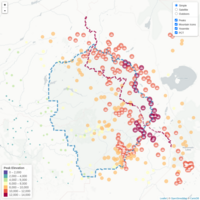
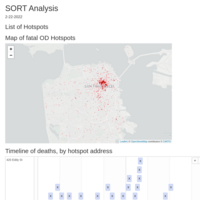
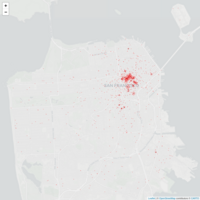
This map displays all fatal overdose deaths in San Francisco from 2020 to 2021 that are included in the OCME records. It highlights in large red circles any address with more than 5 overdose deaths.
OCME Hotspotting Map
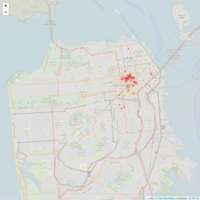
This map displays all OCME overdose deaths in San Francisco from 2020 to 2021. It highlights in large red circles any address with more than 5 overdose deaths.
OCME Map
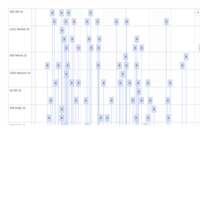
OCME OD deaths from 2020-2021