
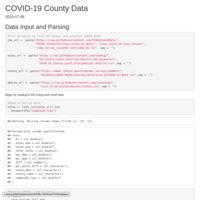
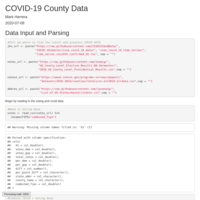
kangen558
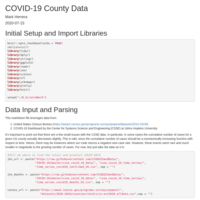
Mark Herrera
Recently Published
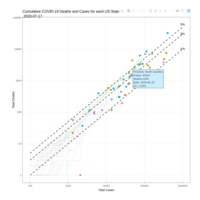
Cases vs Deaths COVID-19: United States
Data Source: COVID-19 Dashboard by the Center for Systems Science and Engineering (CSSE) at Johns Hopkins University
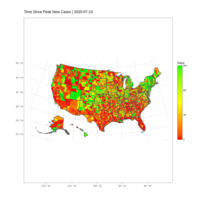
Days Since Peak New Cases Per Day
Sources:-COVID-19 Dashboard by the Center for Systems Science and Engineering (CSSE) at Johns Hopkins University (https://github.com/CSSEGISandData/COVID-19)
Peak values are based one a seven day running average of new cases per day.
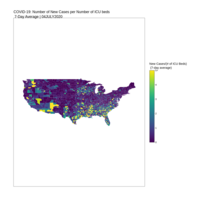
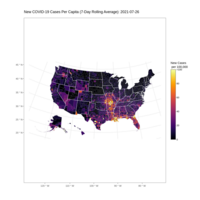
Number of New COVID Cases per ICU Hospital Bed
Sources:-COVID-19 Dashboard by the Center for Systems Science and Engineering (CSSE) at Johns Hopkins University (https://github.com/CSSEGISandData/COVID-19)
https://khn.org/news/as-coronavirus-spreads-widely-millions-of-older-americans-live-in-counties-with-no-icu-beds
Assumptions: (1) In cases where there are no ICU beds in a county, I set the value to ICUbeds = 1 to make the plot understandable. (2) Virginia "independent cities" are not shown on the county level plot.
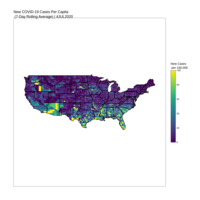
2D COVID Map -- New Cases per Capita
7 Day Rolling Average. Sources for data and generating code can be found here: https://rpubs.com/kangen558/636771
3D Covid Data
made with rayshader (www.rayshader.com)
Covid vs Election Data
Very Rough Draft