Recently Published

Plot
Simple bar plot showing distribution of Data Numeric and categorical variable

Machinelearning Prediction Assignment Write Up
Coursera Machine Learning Assignment

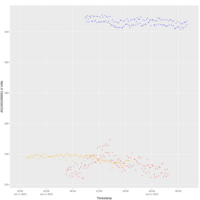
Course Grades & Time Spent
In the scatter plot above, each point indicates the amount of time a student spent and their percentage of total points earned on assignments, which here is used as a close approximation of their final grade.

Minor Project on fake news detection
Fake news detection in the R programming language involves a combination of text analysis, statistical modeling and data visualization tools like "ggplot2" aid in the exploration and presentation of results, contributing to a comprehensive fake news detection in R.


