Recently Published
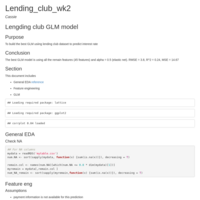
Lending_club_working_glm
Next step: more sophisticated feature engineering and selection
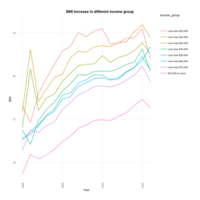
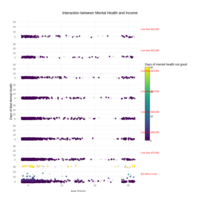
BMI Increase in Different Income Group
Data is from CDC BRFSS survey (2000-2015)
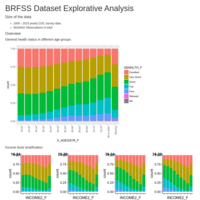
Capstone Summary Week 2
Capstone summary
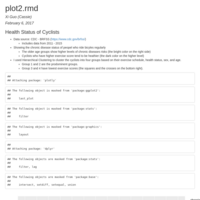
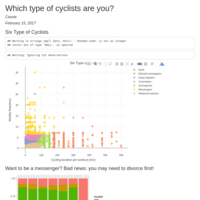
Plot 2 - Health Status of Cyclists
Showing the exercise scores and chronic disease status of cyclists in the US.
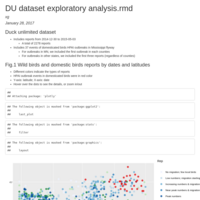
Duck unlimited data exploratory analysis
Plotting the latitudes of the reports
Data was retrieved from duckunlimited.org

Next word prediction
Coursera data science capstone project: using katz back-off model to predict the next word

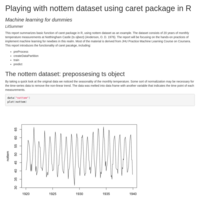
Handling Time Series in R
Basic operations of time series using R

Publish Presentation
A summary of the responses of the moments of truth
SSA analysis - example data
Using example data for singular spectrum analysis in R
Practical machine learning - final project
Using personal activity data to predict the quality of the exercise
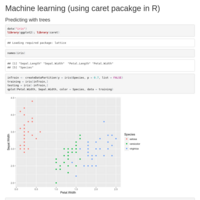
Practical machine learning - Notes
Including predicting with trees, random forest, bootstrapping, bagging, boosting, etc. From JHU machine learning course in Coursera.
ggplot-basic examples
how to make basic plots in ggplot2
Assignment2
This is the RMardown file for the peer assessment 2
