
lokraj
Lok R Joshi
Recently Published
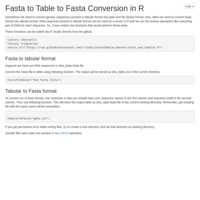
Fasta to Table to Fasta Conversion in R
Functions to convert Fasta format to Tabular format and vice vesa
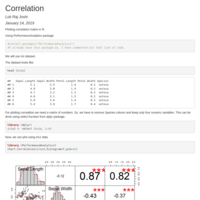
Correlation Plots
Plotting multiple correlation plots in R
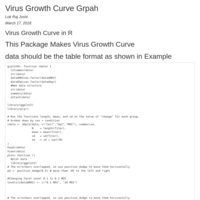
Virus Growth Curve in R
Takes MOI, Titer, Cell type, hours-post infection as a parameter and gives nice growth curve with standard deviation.
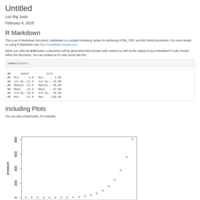
Test
Sample