Recently Published

Building Essential ML Tools Natively on CM4 aarm64
Developing aarm64 Native ML tools on a Raspberry-Pi4 /CM4 is illustrated with building RStudio Desktop IDE from source along with Jupyter Notebook and VS Code Python native aarm64 apps running on Ubuntu 22.04 LTS

Applying ML to Mushroom Classification on aarm64 Pi4 /CM4
The original [RPubs](https://rpubs.com/m3cinc/Machine_Learning_Classification_Challenges) was posted 6 years ago and, at the time, was developed on R3.2.2 running on a quad-core 64-bit Windows8 laptop. Today this slightly rejuvenated and amended code is running on a 64-bit quad-core RaspberryPi CM4.
This is now possible with the open-source RStudio IDE and R4.20 natively built and running smoothly at 2.00 GHz on Ubuntu Mate 22.04 LTS aarch64 desktop!
It is even faster and so impressively runs side-by-side a Python 3.10 Jupyter notebook
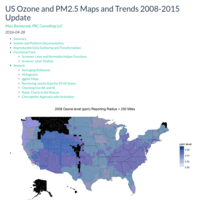
US Ozone and PM2.5 Maps and Trends 2008-2015 Update
This study follows previous analysis and complements it with the full 2015 year data obtained from Annual US Airdata reports, specifically US EPA download site and data repositories, and now spans over the 8-year period (2008-2015). Because reproducibilty was enforced in this study, the updated analysis proceeded smoothly over the completed dataset, resusing the same code, but with up-to-date packages, 9 months after the original study was conducted.
2 pollutants of interest, Ozone and Particulate Material up to 2.5 micro-meters, were selected for comparative and evolutive analysis. The tool was derived from the basic example covered by Dr. Roger D. Peng in the Coursera ’Developing Data Products, Week 4 - yhat module. The core data filtering process is contained in the screener function, where the minimum data is retrieved using an adaptive radius. The screening algorithm is based on the nearest 5 reporting sites, instead of straight averaging within a fixed radius provided. The module also retrieves all data available to date, aggregated on a yearly basis. A yhat module function was also developed to verify functionality, and could be used in a multi-user distributed environment. Multiple methods including averaging a single value per county or mapping the average of the 5 nearest neighbors are performed. Pollutant levels (Ozone and PM2.5) and Radii of Reports are analyzed, indicating the absence of data from HI and very little reporting in AK. The use of radar chart is also quickly demonstrated. However, the evolution of levels and Radii show clear trends over the period 2008 thru 2015 as well as progress in monitoring density overall. A number of interesting differences, distributions and radar charts explain clearly the evolution observed in US. Finally, the choroplethr animation summarizes well the trends in a dynamic web player, and extend mapping to all 50 states.
With complete data thru 2015, the previously observed evolutions were confirmed. Noticeably, high and increasing levels of PM2.5 were reported for CA and NV. Lowest Ozone levels were reported consistently for ME, VE and WA states. Highest Ozone levels were reported consistently over the 2008-2015 period in UT, NV, CO, CA and AZ.

Benchmarking 20 Machine Learning Models Accuracy and Speed
As Machine Learning tools become mainstream, and ever-growing choice of these is available to data scientists and analysts, the need to assess those best suited becomes challenging.
In this study, 20 Machine Learning models were benchmarked for their accuracy and speed performance on a multi-core hardware, when applied to 2 multinomial datasets differing broadly in size and complexity.
It was observed that BAG-CART, RF and BOOST-C50 top the list at more than 99% accuracy while NNET, PART, GBM, SVM and C45 exceeded 95% accuracy on the small Car Evaluation dataset. On the larger and more complex Nursery dataset, we observed BAG-CART, BOOST-C50, PART, SVM and RF exceeded 99% accuracy, while JRIP, NNET, H2O, C45, and KNN exceeded 95% accuracy.
However, overwhelming dependencies on Speed (determined on an average of 5-runs) were observed on a multicore hardware, with only CART, MDA and GBM as contenders for the Car Evaluation dataset. For the more complex Nursery dataset, a different outcome was observed, with MDA, ONE-R and BOOST-C50 as fastest and overall best predictors.
The implications for the Data Analytics Leaders are to continue allocating resources to insure Machine Learning benchmarks are conducted regularly, documented and communicated thru the Analysts teams, and to insure the most efficient tools based on established criteria are applied on day-to-day operations.
The implications of these findings for data scientists are to retain benchmarking tasks in the front- and not on the back-burner of activities' list, and to continue monitoring new, more efficient and distributed and/or parallelized algorithms and their effects on various hardware platforms.
Ultimately, finding the best tool depends strongly on criteria selection and certainly on hardware platforms available. Therefore this benchmarking task may well rest on the data analyst leaders' and engineers' to-do list for the foreseeable future.

Machine Learning, Key to Your Classification Challenges
You develop pharmaceutical, cosmetic, food, industrial or civil engineered products, and are often confronted with the challenge of sorting and classifying to meet process or performance properties. While traditional Research and Development does approach the problem with experimentation, it generally involves designs, time and resource constraints, and can be considered slow, expensive and often times redundant, fast forgotten or perhaps obsolete.
Consider the alternative Machine Learning tools offers today. We will show this is not only quick, efficient and ultimately the only way Front End of Innovation should proceed, and how it is particularly suited for classification, an essential step used to reduce complexity and optimize product segmentation, Lean Innovation and establishing robust source of supply networks.
Today, we will explain how Machine Learning can shed new light on this generic and very persistent classification and clustering challenge. We will derive with modern algorithms simple (we prefer less rules) and accurate (perfect) classifications on a complete dataset.
Machine Learning, Key to Your Formulation Challenges
You develop pharmaceutical, cosmetic, food, industrial or civil engineered products, and are often confronted with the challenge of blending and formulating to meet process or performance properties. While traditional Research and Development does approach the problem with experimentation, it generally involves designs, time and resource constraints, and can be considered slow, expensive and often times redundant, fast forgotten or perhaps obsolete.
Consider the alternative Machine Learning tools offers today. We will show this is not only quick, efficient and ultimately the only way Front End of Innovation should proceed, and how it is particularly suited for formulation and classification.
Today, we will explain how Machine Learning can shed new light on this generic and very persistent formulation challenge. We will discuss the other important aspect of classification and clustering often associated with these formulations challenges in a forthcoming communication

SGT Skip-Gram Good Turing NLP
A Data Science Capstone Project produced this
Self-Learning 5-in-1 Shiny App to Expedite Your Writing !
Natural Language Processing - Coursera Capstone Interim Report
This milestone report covers the preliminary steps performed for the Coursera-Swiftkey Summer 2015 Capstone project: Implementing good practice and Data Science rigor in understanding problem, gathering and reproducibly cleaning data, exploring, charting and planing for the remaining steps.. It prepares for model analysis, machine learning, performance optimization and implementing a creative Shiny Application solution.
US Ozone and PM2.5 Maps and Trends
From Annual US Airdata reports available between 2008 and 2015 on US EPA download site and data repositories, 2 pollutants of interest, Ozone and Particulate Material up to 2.5 micro-meters, were selected for comparative and evolutive analysis. The tool was derived from the basic example covered by Dr. Roger D. Peng in the Coursera ’Developing Data Products, Week 4 - yhat module. The core data filtering process is contained in the screener function, where the minimum data is retrieved using an adaptive radius. The screening algorithm is based on the nearest 5 reporting sites, instead of straight averaging within a fixed radius provided. The module also retrieves all data available to date, aggregated on a yearly basis. A yhat module function was also developed to verify functionality, and could be used in a multi-user distributed environment. Multiple methods including averaging a single value per county or mapping the average of the 5 nearest neighbors are performed. Pollutant levels (Ozone and PM2.5) and Radii of Reports are analyzed, indicating the absence of data from HI and very little reporting in AK. The use of radar chart is also quickly demonstrated. However, the evolution of levels and Radii show clear trends over the period 2008 thru 2015 as well as progress in monitoring density overall. A number of interesting differences, distributions and radar charts explain clearly the evolution observed in US. Finally, the choroplethr animation summarizes well the trends in a dynamic web player, and extend mapping to all 50 states.
Data Pre-Processor Published Presentation
This is the 5-slides Data Pre-Processor presentation made with RStudio Presenter. It describes the functionality and implementation techniques of the corresponding RStudio Shiny Application also published at https://m3cinc.shinyapps.io/App-3/.
It has multiple CSS and links implemented with transitions and reproducible R functionality. Enjoy!

RR PA2 - Analyzing NOAA Events to Map and Rank Top US Weather Threats.
In a reproducible way, and using R-Studio tools, this analysis script retrieves and process NOAA catalogued weather events to extract most harmfull or damaging threats affecting the United States. The analysis will attempt to answer: "Where, How Often and What Type of Events constitute for each state his major threats?". After documenting the tools, retrieval anc cleaning/reformatting of the data, an analysis is conducted to extract, rank the Top5 and display the major weather threats catalogued up to 2011. Four different categories representing facets ot this threat affecting Fatalities, Injuries, Property Damages and Crop Damages, quantify these threats as catalogued in the NOAA database as EVTYPE. The Top5 threats of each category are extrated for each US State, and their yearly rate is normalized and combined. Visualization is made easy thru mapping accross the US, for both relative impact and relative frequency. This is performed on a spectrum of time windows, ranging between 5 to 25 years span to discern trends, and presented side-by-side. Having assessed cumulative risk impact and frequency by location, the last step of this analysis quantifies and compares each US State side-by-side with their respective cumulated threat index, with most impacting individual event types quantified and color coded. It is expected that this type of analysis will contribute in event preparation, based on prior events occurence, impact, frequency and localization.