
marcelMerchat
Marcel Merchat
Recently Published
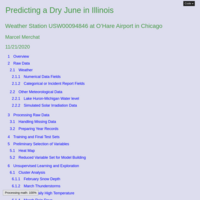
Predicting a Dry June in Illinois
The report describes making predictions using machine-learning while comparing these methods:
A. Ordinary-least-squares
B. Partial-least-squares (PLS)
C. Pre-processing with Principal-Components-Analysis followed by PLS
D. Ridge regression
Overview
The Farmer's Almanac advises about "A cold and wet June" and it might seem foolhardy to improve upon a maxim like this one or try to predict anything about weather, but this investigation nevertheless considers whether anything might be gained if we apply machine-learning or artificial intelligence to weather records from O'Hare Airport at Chicago, Illinois covering the years from 1960 to 2018. This analysis certainly shows the difficulties in weather prediction, but perhaps it shows that the likelihood or probability of a wet June appears be weakly correlated with snow in February and cold weather in early spring and other variables over the previous months of a yearly weather record.
We develop models for four algorithms that predict the amount of June rain and compare the mean-squared-error for these models using cross-validation. Finally, we perform final tests for which the bias, variance, and mean-square-error is presented for each method.
The low correlation of June rain with February snow and cold weather in March and April changes the probability of a dry June a small but statistically
significant amount, particularly for wet cluster years with predicted rain
level over 100-mm. The years in the dry cluster seem to have a more or less constant rain level, independent of the amount of predicted rainfall. None of the dry cluster years have June rain predictions above 100-mm while the three wettest years have predictions above 100-mm as shown in the exploratory plot of Figure-6.
The reproducible code for this project and report is shared at this address:
https://github.com/marcelMerchat/dry_june_in_illinois
# Raw Data
The raw weather data is for Station USW00094846 at O’Hare Airport at
Chicago, Illinois covering the years from 1960 to 2018. The raw data was
processed to make a data frame of year records that also including the level
of Lakes Huron-Michigan and simulated solar irradiation levels. The raw data
for O’Hare Airport was automatically downloaded following the application
programming interface (API) at the National Centers for Environmental
Information (NCEI) for the United States Government. The following query
parameters were appended to the internet address to fetch the data:
stations=USW00094846, startDate=1958-01-01, endDate=2019-07-01, format=csv
The download is saved as the file named ChicagoWeather2018.csv.
## Numerical Data Fields
These fields were selected for analysis:
PRCP, Precipitation (tenths of mm)
SNOW, Snowfall (mm)
SNWD, Snow depth (mm)
TMAX, Maximum temperature in tenths of degrees (°C)
TMIN, Minimum temperature in tenths of degrees (°C)
AWND, Average daily wind speed (tenths of meters per second)
WDF2, Direction of fastest 2-minute wind (degrees)
WSF2, Fastest 2-minute wind speed (meters per second)
WSF5, Gust intensity as fastest 5-second wind speed (meters per second)
WT01, Fog, ice fog, or freezing fog (may include heavy fog)
WT03, Thunder
WT05, Hail
WT08, Smoke or haze
WT09, Blowing or drifting snow
WT11, High or damaging winds
WT13, Mist
WT16, Rain (may include freezing rain, drizzle, and freezing drizzle)
WT17, Freezing rain
WT18, Snow, snow pellets, snow grains, or ice crystals
## Other Meteorological Data
Although we only use the above weather data from Station USW00094846 at O’Hare Airport for our final predictions, we also explored if the level of Lakes
Huron-Michigan or solar irradiation levels were correlated with June rain,
but this other meteorological data was eliminated from model-building and
prediction as the airport weather data provides most of the predictive power.
## Lake Huron-Michigan Water level
The Army Corp of Engineering considers Lakes Huron and Michigan as a single body of water with the same average water level. The monthly mean water level for Station 9075014 at Harbor Beach, MI and Station 9087044 at Calumet Harbor in Illinois was automatically downloaded from the NOAA government website with query parameters to select to select the years beginning with the 1958-1959 snow year and ending with the 2018-2019 snow year where a snow year begins on July 1 and ends the following calendar year on June 30. The monthly mean water level for Station 9087044 at Calumet Harbor was used for the analysis. As only airport weather data was selected for the final models, the dimension of the solution was reduced by elimination of lake level variables from the model. However, the lake data is still part of the data frame and file of all variables.
## Simulated Solar Irradiation Data
Solar data was not selected for the final models despite having some low
correlation with June rain as the weather variables in the airport data have
higher correlation. Since it might be unwarranted to discard the perturbation
of the earth’s orbit and the solar irradiation levels for the earth caused by
the gravitational pull of Jupiter without understanding how insignificant this
might be, the solar data requires further study. The description of the
simulated solar irradiation data is included in the Appendix at Section-10.6
of the report.
The code for generating the raw solar data is contained in the file named
SunJupiterEarthSimulation.R. The raw data was processed to produce monthly and year averages as described below under preparing year records.

Analysis of Electric Power Reliability
This report concerns SAIDA and SAIFI data for more than five hundred electric utility companies that reported to the United States Department of Energy (DOE) according to the IEEE-1366 standard in the three years from 2013-2015. We also discuss the event time data found in Electric Disturbance reports for the years 2011-2016 which are filed on Form OE-417 for larger power disruptions. We investigate the reliability data which was uniformly reported beginning in 2013 and the detailed event data which became available starting in 2011.

Census Bureau Data on Leaflet Map
This web page was made using knitr with R-tools. Its success depends on the acs package, Version 2.1.1, dated July 22, 2017 by Ezra Haber Glenn. This version is running on Microsoft Windows with https website downloads. The page describes census bureau income data for Lancaster County, Pennsylvania. The details of the R Markdown program are in this Github repository:
https://github.com/marcelMerchat/census_bureau_map_income

LabVIEW Project Planning
This internet slide show describes planning a LabVIEW project.

LabVIEW Project Plan
This is an internet slide show that discusses planning a LabVIEW Project.

Document
This report describes predicting product failure rates using the Weibull probability distribution and accelerated temperature tests based on the Arrhenius equation.
Document
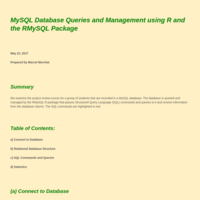
The document describes an R program that queries and manages an Oracle MySQL database.

Document
This is a reproducible report describing a breast cancer prediction algorithm based on the University of Wisconsin 2016 dataset.

Document
This webpage describes a cancer prediction formula from a 2016 University of Wisconsin the breast cancer data set.

Publish Presentation
This slideshow is a modified version of the slides for the Capstone Project.

Publish Presentation
This is a modified version of the slideshow for the Capstone Project.

Publish Presentation
This is a modified version of the slideshow for the Capstone Project.
Publish Presentation
This is a amended version of the slide show used for the Capstone Project.

Publish Document
This is the Slidify version of the Rpres slide show.

Publish Document
This is a slidify version of the slide show for my Coursera-John Hopkins Data Science Capstone Project. It was originally submitted as an Rpres document.

Publish Presentation
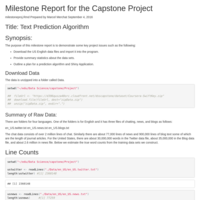
This is a slide show that demonstrates a text prediction algorithm for the Capstone Project of the Coursera John Hopkins Data Science Program.

Publish Presentation
This is a slide show that discusses a text prediction algorithm for the Coursera John Hopkins Data Science Program.

Publish Presentation
This is a side show demonstration for the Capstone Project for text prediction.

Publish Presentation
This is an Rstudio Presentations slide show that complements the class project for the Data Products Class for the Cousera John Hopkins Data Science program.

Publish Presentation
This is an HTML slide show that complements the interactive website that
was submitted for the Class Project for the Data Products Class of the
Coursera John Hopkins Data Science program.

Publish Presentation
This is an html Rstudio Presentations slide show that describes the data product study that was prepared for the class project.
Analysis of Severe Weather Events
Corrected Version

PeerAssessment2
An Analysis of Weather Analysis for Emergency Weather Management
A Coursera Class Assignment