
mattshank20
Matthew Shank
Recently Published

1821 points on map
1821 SIS samples + SLIMS + geology + sinkholes + major drainages. Updated 2026-01-21

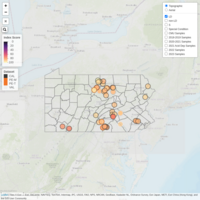
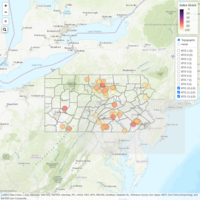
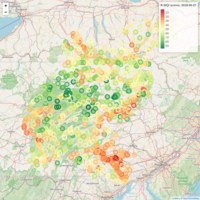
PADEP WQI Mapper
Interactive map of PADEP WQI Level III data. Version 20260101

r workshop map 20250327
this is our map

PADEP Macroinvertebrate Data Dictionary
Tabbed website that includes a README tab with an overview, a Data Dictionary with column definitions, and the PADEP recognized macroinvertebrates as an interactive and downloadable table

AFS workshop ATI map
Description

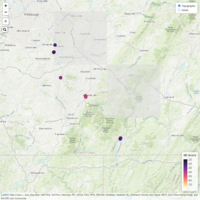
WQN reference stream search
Existing physical, chemical, and biological data were examined for streams < 25 sq. mi. in Mifflin, Juniata, and Huntingdon counties to find potential reference candidates to serve as WQN stations beginning in 2025
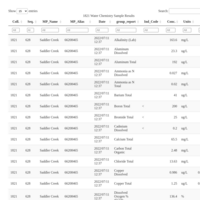
1821 chemistry results
1821 SIS samples - interactive table
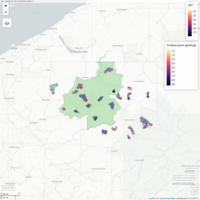
Geospatial R workshop map
we did it
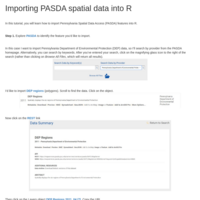
Importing PASDA spatial data into R
This is a tutorial of the process necessary to import spatial data from PASDA into your R project
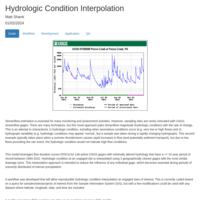
Hydrologic Condition Interpolation
Estimation of hydrologic condition and rate of change for ungaged locations in PA.
Diatom Technical Document Interactive Map 2023-11-06
Interactive Map of PADEP Diatom Index. Popup boxes include information on DI Scores, Site Info, Taxa Relative Abundances, and Water Quality information

Interstate Macro Acid Tolerance Comparisons
Comparison of macroinvertebrate acid tolerance values between PADEP, WVDEP, and VADEQ.
Oemopteryx or Taenionema?
Expert input and SLIMS entries for Oemopteryx and Taenionema
2022 Bio Meeting RBP training
PADEP conducted a physical habitat assessment training/calibration during the 2022 Biologists Meeting in Williamsport on October 20, 2022. The results were compiled and examined to identify parameters with weak precision that may deserve attention during future training/calibration events.
RBP vs. WQI
Tool to quickly find sites with good RBP and bad WQI
Simulidae Analysis
Spatio-temporal dynamics and effects on IBI scores
DEP, SRBC, Heard ea 1997 fish
All DEP and SRBC sampling points, symbolized by TFI. Heard et al. (1997) site locations and TFI scores also displayed.

Heard ea 1997 fish
Locations of Heard et al 1997 sampling sites. TFI scores for Heard sites and proximate SRBC and DEP fish surveys.

SRBC Fish - TFI Map
TFI scores, taxa abundances, site information, and site attributes are available in pop-up boxes. Points are filled by TFI score, bordered with method. Layers of fish, site attributes, and hydrology are included. Updated 2021-08-18

Bug LUT
interactive Bug LUT
NSH BCAT
PA AFS WOrkshop
Interactive Mapping in R
Don't get caught up in the static

Susquehanna River eDNA Map
eDNA Results of Northern Snakehead and Blue Catfish sampling in the lower Susquehanna River in 2019 and 2020.
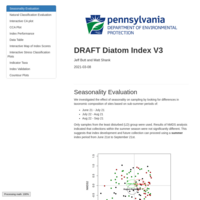
Diatom Index V3
DRAFT Diatom update materials 20210209
Draft Diatom Index Scores 2021-02-09
2D Diatom Index Score. 2021-01-13. Draft.
Youghiogheny Bug IBI Score Map
6D 200 only - all samples available on the Yough mainstem

Draft Diatom Index Scores 2021-01-13
2D Diatom Index Score. 2021-01-13. Draft.
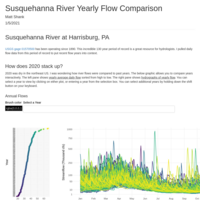
Susquehanna River Yearly Flow Comparison
Comparison of 130 years of flow on the Susquehanna River at Harrisburg, PA

IR mock-up map
TP Yields across PA with an image popup
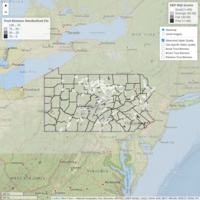
WQN Proposed Modification Map
Updated 2020-09-15

Hay Creek Project Map
Hay Creek Project Interactive Map: Site and Chemistry Data for K Bardell
Monomeric vs. Dissolved Aluminum
Data visualization and analysis of differences between monomeric and dissolved aluminum in PA

Monomeric Aluminum in PA
Overview of monomeric Aluminum data availability statewide, limitations with the dataset, and suggestions for improving utility.
Draft Diatom Map
Under Construction
2020 Taxa Revision Analysis
Draft of Tier I analysis on PADEP taxonomic revisions
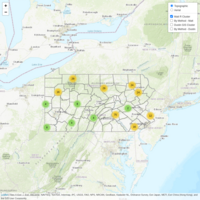
FAME Nutrient Distributions
Analysis of distribution of drainage size, land use, and nutrient concentrations at FAME and WQN sites.
Taxa Revision Analysis -- Site Cluster Map
Interactive map showing results of cluster analysis performed in R (Matt), cluster analysis performed in ArcPro (Dustin), and clusters by method.

Creating and Committing a GitHub Repository
This tutorial shows the process necessary to commit your working directory to a github repository. A workflow for accessing data directly from github is also included
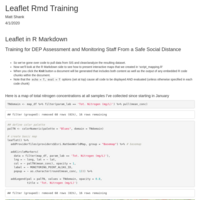
leaflet rmd training
description
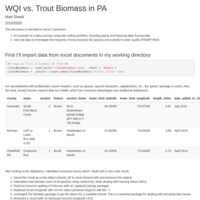
WQI vs. trout biomass
Interactive map visualization of trout biomass and water quality within HUC12 watersheds where both data types are available.
Potentially incorrect spatial WQN stations in WQI dataset
Spatial analysis of differences in site coordinates between WQI (SIS) and WQN datasets
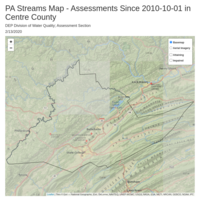
Centre Co. Assessments
Proof of concept of IR map. Assessments since 2010-10-01 in Centre Co.

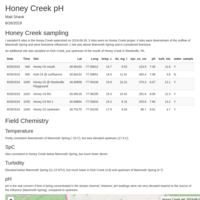
Honey 2019-08-26
Honey Creek field chemistry sampling 2019-08-26
