
mgei
Martin Geissmann
Recently Published


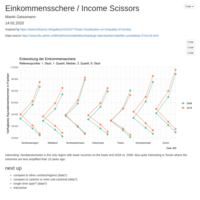
Einkommensschere / Income Scissors
Visualizing the income gap in Switzerland by region for 2018 vs. 10yrs ago.
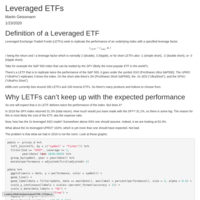
Leveraged ETFs
Leveraged Exchange-Traded Funds (LETFs) seek to replicate the performance of an underlying index with a specified leverage factor.
rLETF=rindex∗l
r being the return and l a leverage factor which is normally 2 (double), 3 (tripple), or for short LETFs also -1 (simple short), -2 (double short), or -3 (tripple short).
Take for example the S&P 500 Index that can be traded by the SPY (likely the most popular ETF in the world?).
There’s a LETF that is to replicate twice the performance of the S&P 500, it goes under the symbol SSO (ProShares Ultra S&P500). The UPRO (“UltraPro”) replicates 3 times the index. On the short side there’s SH (ProShares Short S&P500), the -2x SDS (“UltraShort”), and the SPXU (“UltraPro Short”).
etfdb.com currently lists around 200 LETFs and 100 inverse ETFs. So there’s many products and indices to choose from.
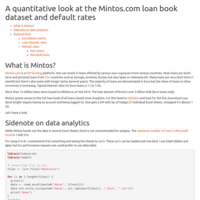
A quantitative look at the Mintos.com loan book dataset and default rates
Mintos is a P2P lending platform. One can invest in loans offered by various loan originators from various countries. Most loans are short-term and personal loans from FSU countries such as Georgia, Armenia, Russia, but also Spain or Indonesia etc. Many are very short term (1 month), but there's also some with longer terms (several years). The majority of loans are denominated in Euro but the share of loans in other currencies is increasing. Typical interest rates for Euro-loans is 11 to 13%.
More than 13 million loans were issued on Mintos as of mid 2019. The loan amount offered is over 3 billion EUR (Euro loans only).
Mintos grants access to the full loan book of all loans issued since inception. For this head to Mintos / Statistics and look for the link Download Loan Book (might require having an account and being logged in). One gets a ZIP with (as of today) 27 individual Excel sheets. Unzipped it's abozut 1 Gb.
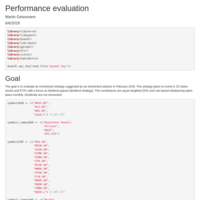
Portfolio performance evaluation
The goal is to evaluate an investment strategy suggested by an investment advisor in February 2016. The strategy plans to invest in 20 Swiss stocks and ETFs with a focus on dividend payout (dividend strategy). The constituents are equal weighted (5%) and rule based rebalancing takes place monthly. Dividends are not reinvested.
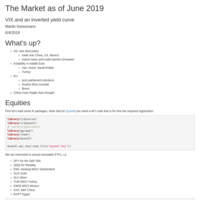
Market as of June 2019, VIX and the inverted yield curve
A look at the current stock market and at the VIX and the yield curve (term structure of interest rates) in R.
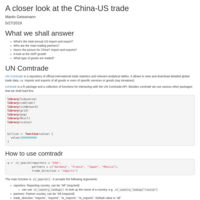
A closer look at the China-US trade
What’s the total annual US import and export?
Who are the main trading partners?
How’s the picture for China? Import and exports?
A look at the GDP growth
What type of goods are traded?
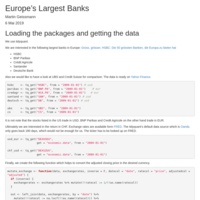
Europe’s Banks (stock prices, exchange rates, and ggplots)
We use tidyquant to get data from Yahoo Finance and from FRED. We create simple a function to convert to the right currency. Finally, we plot the stock price development.
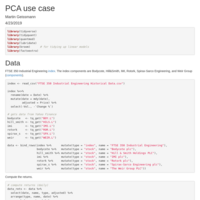
PCA use case
Using PCA to replicate the FTSE 350 Industrial Engineering index. Finding out which stocks are the best proxies to track the index.

Analyzing the Swiss cantons with more lawyers than medical doctors
In 2017 Switzerland had 18’858 free physician working in individual doctor’s offices (Aerzte mit Praxistätigkeit as opposed to doctors employed by hospitals). Also Switzerland currently has 12’967 registered lawyers. Relative to the number of inhabitants of nearly 8.5 million (2017), that’s on average 2.2 physicians and 1.5 lawyers per 1’000 inhabitants.
As we will see, in four cantons lawyers outnumber physicians.

How far to the closest hospital?
A drive time interpolation map using an easy to create local OSRM instance and relying on the common R packages for geospatial analysis (ggmap, raster, gstat etc). The maps are interactive and created with leaflet.