
mikeShout
Mike
Recently Published
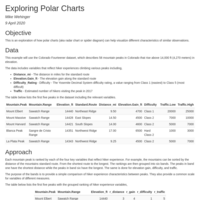
Exploring Polar Charts
This is an exploration of how polar charts (aka radar chart or spider diagram) can help visualize different characteristics of similar observations.
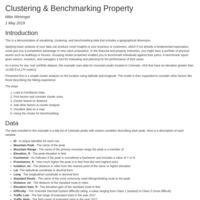
Clustering & Benchmarking Property
This is a demonstration of visualizing, clustering and benchmarking data that includes a geographical dimension.

WhatsNext App
A presentation explaining a text prediction app for the Capstone project in the John Hopkins University Data Science specialization through Coursera and in partnership with Swiftkey.
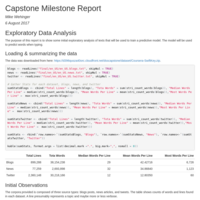
Predictive Text Milestone Report
Predictive Text Milestone Report for capstone class in Data Science Coursera course by John Hopkins University
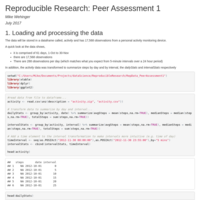
Reproducible Research Assignment for
Reproducible Research Assignment for John Hopkins University Data Science specialization on Coursera

Snow Adviser App
The final assignment in the Data Products class offered by John Hopkins University on Coursera

New Zealand Ski Fields
Presentation for Data Science project in week 3 of Developing Data Products
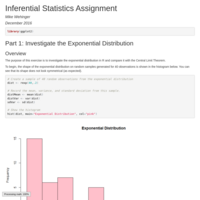
Inferential Statistics Assignment
The purpose of this exercise is to investigate the exponential distribution in R and compare it with the Central Limit Theorem.
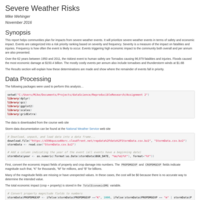
Severe Weather Risks
This report helps communities plan for impacts from severe weather events.
This report is part of a homework assignment for the Reproducible Research class in the John Hopkins Data Science Specialization