mnajdan
Michael Najdan
Recently Published

Difference between Batting average and Bowling average by Team
County Championship 2024-2026

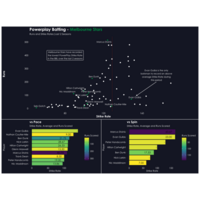
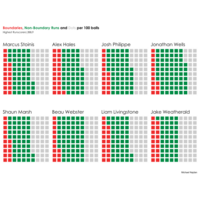
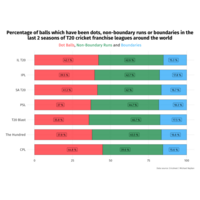
Boundaries, Non-Boundary Runs and Dots per 100 balls for the Top 8 run scorers in the 2024 T20 Blast
The visualisation shows the split between boundaries, non-boundary runs and dots per 100 balls for the top 8 run scorers in the 2024 T20 Blast in England. Total runs in brackets.


Correlation Matrix of Performance Variables from the 2020-21 EPL Season
Analysis of the correlation between Expected Goals (xG), Pass Completion (PassComp), Possession (Poss), Goals Scored (GF) and Points (Pts) in the 2020-21 EPL season
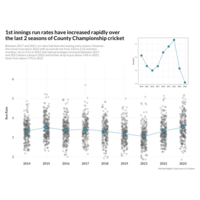
1st Innings County Championship run rates have increased over the last 2 seasons
An analysis of 1st Innings run rates and dot ball percentages over the last 9 seasons of English County Championship Cricket
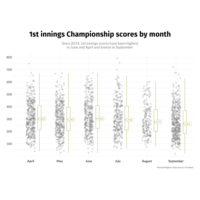
1st Innings Championship Scores by Month
An analysis of all 1st innings scores in the County Championship since 2014 by month
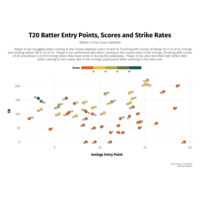
T20 Batter Entry Points, Scores and Strike Rates
Analysis of when a T20 batter faced their first ball and their final score and strike rate. Their final score is labelled

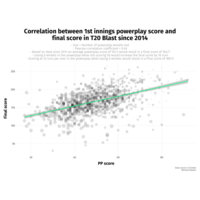
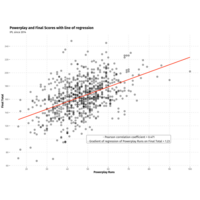
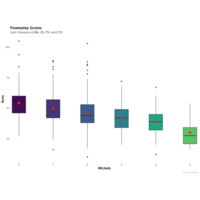
Correlation between 1st innings powerplay score and final score in T20 Blast since 2014
Analysis showing the correlation between 1st innings power play scores and final score in T20 Blast matches since 2014.
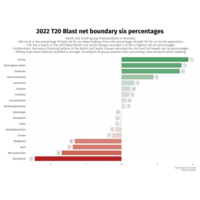
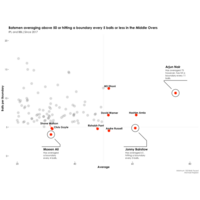
2022 T20 Blast net boundary six percentages
Net six % is the precentage of balls hit for six when batting minus the percentage of balls hit for six by the opposition. The analysis shows each team's net boundary 6 percentages combined with their final positions in the 2022 North and South groups.
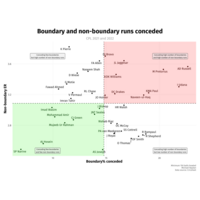
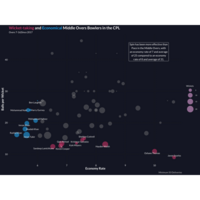
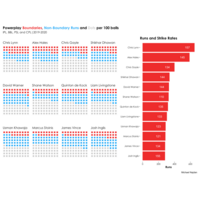
Boundary and non-boundary runs conceded in the last 2 seasons of the CPL
An analysis of how bowlers have conceded their runs in the last 2 seasons of the CPL. The green area highlights the bowlers with a low % of runs conceded in boundaries and a low non-boundary ER. The red area highlights the bowlers with a high % of runs conceded in boundaries and a high non-boundary ER.
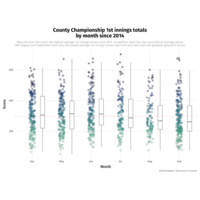
County Championship 1st innings totals by month
Analysis showing 1st innings totals by month in the County Championship since 2014. May and June have been the best months to bat in the 1st innings of matches. August and September have been the toughest with the lowest average 1st innings scores. April and July have seen the greatest spread of scores.
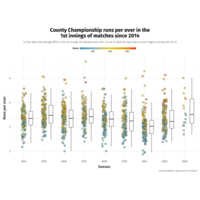
County Championship runs per over in the 1st innings of matches since 2014
A look at the runs per over in the 1st innings of County Championship matches since 2014. 3.3 has been the average RPO in this period. The 2023 season has seen a much quicker scoring rate so far, with a rate of 3.6 runs per over, the quickest scoring rate over the last 9 seasons. The scoring rate in the 2015 and 2017 seasons were also above average for this period. The 2021 season saw the lowest 1st innings scoring rate.
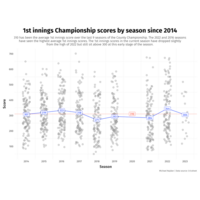
1st innings County Championship scores by season since 2014
A look at the 1st innings scores and average scores in the County Championship since 2014. 310 has been the average 1st innings score since 2014 with the 2022 and 2016 seasons seeing the highest average scores in this period. The 2018 season saw the lowest average 1st innings score. At this early stage the 2023 average score is slightly below average but still above 300.
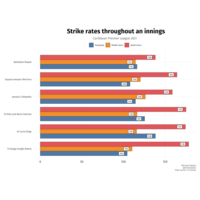
Strike rates throughout an innings - CPL 2021
Comparing strike rates for each team in the powerplay, middle overs and death overs in the 2021 season of the Caribbean Premier League.
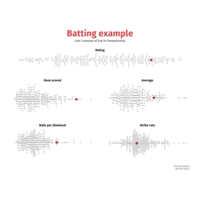
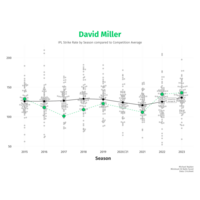
Batting dashboard example
Batting dashboard highlighting the performance of a particular batter in comparison to their peers.
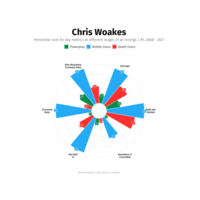
Chris Woakes - IPL Bowling
Analysis showing Chris Woakes's percentile rank for key bowling metrics at different stages of an IPL innings
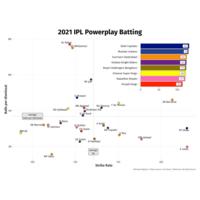
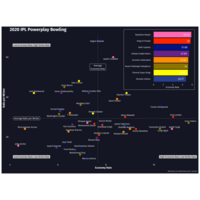
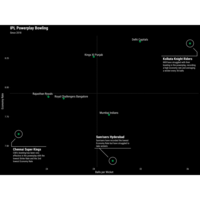
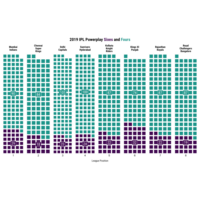
2021 IPL powerplay batting
A look at individual and team performances in the powerplay overs of the 2021 IPL

How did losing wickets in the powerplay affect powerplay and final scores in WBBL 2021/22?
An updated look at how losing wickets in the powerplay has affected powerplay and final scores in the recently completed WBBL 2021/22, and how this compares to previous seasons.
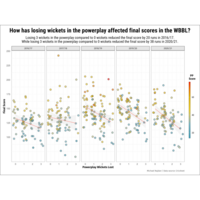
How has losing wickets in the powerplay affected final scores in the WBBL?
A look at how losing wickets in the powerplay has affected final scores in each season of the WBBL. Losing 3 wickets in the powerplay compared to 0 wickets reduced the final score by 20 runs in 2016/17. While losing 3 wickets in the powerplay compared to 0 wickets reduced the final score by 38 runs in 2020/21.
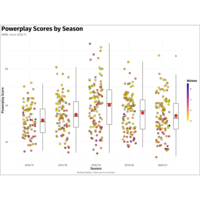
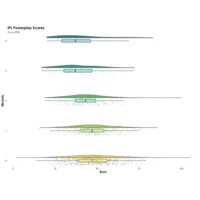
WBBL Powerplay Scores by Season
Powerplay scores by season in the WBBl since 2016/17 with wickets lost colour-coded. The red dot signifies mean power play runs by season.
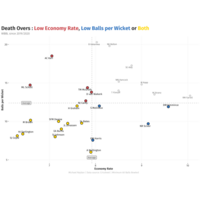
WBBL Death Overs Bowling
Visualisation highlighting bowlers with better than average economy rates, better than average balls per wicket or both in the WBBL Death Overs in the last 2 seasons
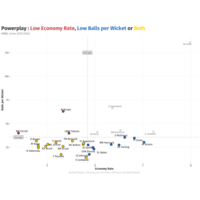
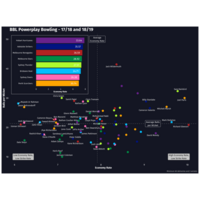
WBBL Powerplay Bowling
Visualisation highlighting bowlers with better than average economy rates, better than average balls per wicket or both in the WBBL Powerplay over the last 2 seasons
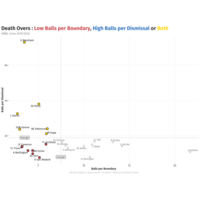
WBBL Death Overs Batting
Visualisation highlighting batters with better than average balls per boundary, better than average balls per dismissal or both in the WBBL Death Overs in the last 2 seasons
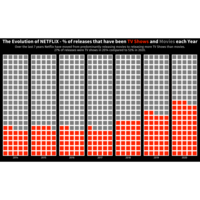
The Evolution of NETFLIX - % of releases that have been TV Shows and Movies each Year
Tidy Tuesday - 20/04/2021
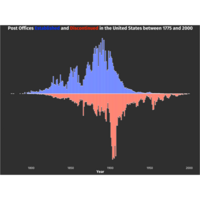
Post Offices Established and Discontinued in the United States between 1775 and 2000
Tidy Tuesday 13/04/2021
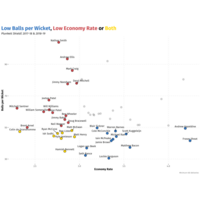
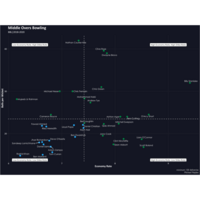
Plunkett Shield Bowling Analysis
Visualisation showing bowlers with low balls per wicket, low economy rate or both in the Plunkett Shield in 2017/18 and 2018/19 seasons