
moeensaiket
Mohammad Wali Ullah
Recently Published
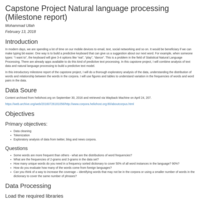
Capstone Project Natural language processing (Data Science Specialization Milestone report)
In modern days, we are spending a lot of time on our mobile devices to email, text, social networking and so on. It would be beneficiary if we can make typing bit easier. One way is to build a predictive keyboard that can give us a suggestion about our next word. For example, when someone types: “I want to”, the keyboard will give 3-4 options like “eat”, “play”, “dance”. This is a problem in the field of Statistical Natural Language Processing. There are already apps available to do this kind of predictive text processing. In this capstone project, I will combine analysis of text data and natural language processing to build a predictive text model.
In this introductory milestone report of the capstone project, I will do a thorough exploratory analysis of the data, understanding the distribution of words and relationship between the words in the corpora. I will use figures and tables to understand variation in the frequencies of words and word pairs in the data.

Shiny App presentation
The app does some data analysis upon users command on mtcars data set. It contains two tabpanels.
- In this first panel, it asks the user to choose three variables to make a plot with a linear regression line.
- In the second panel, a comparison between two prediction model (rpart and random forest) is implemented.

2016 Census of Population in British Columbia
The population and area information of different cities in British Columbia, Canada is plotted using plotly.
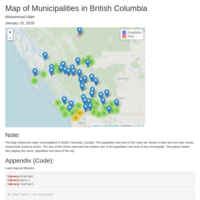
Map of Municipalities in British Columbia
A simple map of Municipalities in BC, created using leaflet in R. The popup Markers show the population and area of the Municipality.

Practical Machine Learning Project (Human activity recognition of weight lifting exercises)
It is now possible to collect personal movement data relatively inexpensively by using devices such as Jawbone Up, Nike FuelBand and Fitbit. Activity recognition research is generally focused on predicting what kind of activity is performed at a specific point in time. On the contrary, how well an activity is performed, is traditionally neglected. In this project, we used weight lifting exercises dataset from accelerometers on the belt, forearm, arm, and dumbell of 6 participants [1] to build a model to predict the manner in which they did the exercise.
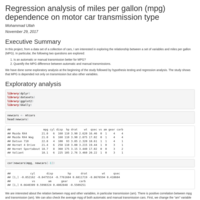
Regression analysis of miles per gallon (mpg) dependence on motor car transmission type
In this project, from a data set of a collection of cars, I am interested in exploring the relationship between a set of variables and miles per gallon (MPG). In particular, the following two questions are explored:
Is an automatic or manual transmission better for MPG?
Quantify the MPG difference between automatic and manual transmissions.
We have done some exploratory analysis at the beginning of the study followed by hypothesis testing and regression analysis. The study shows that MPG is depended not only on transmission but also other variables.
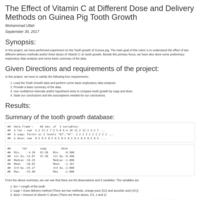
The Effect of Vitamin C at Different Dose and Delivery Methods on Guinea Pig Tooth Growth
In this project, we have performed experiment on the Tooth growth of Guinea pig. The main goal of this rubric is to understand the effect of two different delivery methods and/or three doses of Vitamin C on tooth growth. Beside this primary focus, we have also done some preliminary exploratory data analysis and some basic summary of the data.

Investigation of exponential distribution and comparison with Central Limit Theorem
The main goal of this project was to show that, whether the distribution of a large number (1000) of averages of 40 random exponential follow the Central Limit Theorem (CLT). It means, the distribution will follow an approximate normal distribution. Beside that, we have also showed that simulated sample mean and variance is very close to theoretical mean and variance.
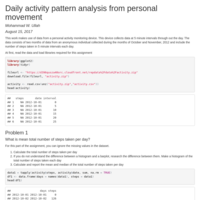
Daily activity pattern analysis from personal movement
This work makes use of data from a personal activity monitoring device. This device collects data at 5 minute intervals through out the day. The data consists of two months of data from an anonymous individual collected during the months of October and November, 2012 and include the number of steps taken in 5 minute intervals each day.
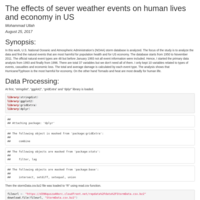
The effects of sever weather events on human lives and economy in US
In this work, U.S. National Oceanic and Atmospheric Administration's (NOAA) storm database is analyzed. The focus of the study is to analyze the data and find the natural events that are most harmful for population health and for US economy. The database starts from 1950 to November 2011. The official natural event types are 48 but before January 1993 not all event information were included. Hence, I started the primary data analysis from 1993 and finally from 1996. There are total 37 variables but we don't need all of them. I only kept 10 variables related to types of events, casualties and economic loss. The total and average damage is calculated by each event type. The analysis shows that Hurricane/Typhoon is the most harmful for economy. On the other hand Tornado and heat are most deadly for human life.