Recently Published
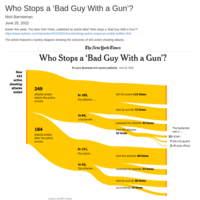
Who Stops a ‘Bad Guy With a Gun’?
Using vtree to display data from an article in The New York Times (https://www.nytimes.com/interactive/2022/06/22/us/shootings-police-response-uvalde-buffalo.html)
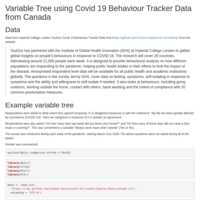
Variable Tree using Covid 19 Behaviour Tracker Data from Canada
Using data from Data from Imperial College London YouGov Covid 19 Behaviour Tracker Data Hub
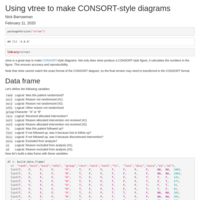
Using vtree to make CONSORT-style diagrams
vtree is a great way to make CONSORT-style diagrams. Not only does vtree produce a CONSORT-style figure, it calculates the numbers in the figure. This ensures accuracy and reproducibility.
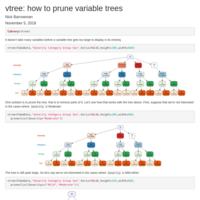
vtree: how to prune variable trees
How to prune variable trees

Data exploration with vtree: diabetes dataset
Using vtree to explore the diabetes dataset from http://biostat.mc.vanderbilt.edu/DataSets

Data exploration with vtree: Missing Values
The Acute Bacterial Meningitis (abm) dataset from http://biostat.mc.vanderbilt.edu/DataSets is used to illustrate how to examine missing data patterns using vtree