Recently Published
Introduction and applied application of Time Series in R_R-Tutorial_udemy
Introduction to Time Series in R_R-Tutorial_udemy. The topics/implementation covered include ETS, ARIMA, forecast packages functionalities, VAR and NNAR. Four small time series projects are also done covering topics such as multivariate time analysis, irregular time series handling etc
Complete MLand DL using H2o_AutoML
AutoML is a function in H2O that automates the process of building a large number of models, with the goal of finding the “best” model without any prior knowledge or effort by the Data Scientist. This is a comprehensive example of AutoML functionality in H2O R Package
Complete Machine Learning and Deep Learning With H2O in R
Complete Machine Learning and Deep Learning With H2O in R
Tidying data using tidyverse R package
Tidy Data Processing using tidyr and dplyr inR
Udemy course by Minerva Singh
Secret Santa in R
The following R code shows how to create a random Secret Santa list by two different methods.(I have shamelessly lifted the concept from others and hence not my original work).
Multi dataset & model combinations using Purrr and caret
Create hundreds of dataset + model combinations, store data & model objects neatly in one tibble, and post process programatically. Purrr package enables succinct functional programming in which a lot gets done with just a few lines of code. Also other similar iterative methods bench marked and compared.Ending the article with Forecasting multi timeseries in couple of lines of code using purrr .....WIP
Spam or Ham message Classification
Classifying messages as Spam or Ham using a simple Naive Bayes classifier and some natural language processing.
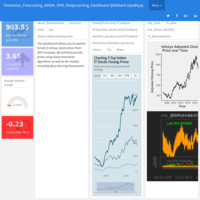
Flexdashboard- Timeseries Forecasting: ARIMA ML & DeepLearning frameworks
This is a small attempt in creating dashboard using R (Flexdashboard package). This dashboard allows one to explore trends in Infosys stock prices from 2007 onwards. We will also forecast Infosys prices using many timeseries algorithms as well as ML models including deep learning frameworks......Just playing around....
Applied TimeSeries Analysis_NPTEL IITMadras_ArunTangirala
This document is Week 1 of Applied Time-Series Analysis (MOOC) Course offered by Prof. Arun K. Tangirala, IIT Madras through NPTEL during Jan-April 2017........
Building R package from scratch:A beginner’s tutorial
This is my first attempt to build my own local R package ......YaY!....feels good to progress from an R user to R package creator albeit a small beginning....
Data Analysis for Life Sciences 4_High-Dimensional Data Analysis:HarvardX PH525.4x
This is the fourth MOOC in the PH525x series - Biomedical Data Science offered by HarvardX on edX. I have tried to capture the entire offering in the markdown as a single document.This covers first two weeks module--WIP
Merry Christmas Tree & Happy New Year in R
Christmas Tree & HNY in R.
Parallel processing in R
This is just a basic overview of parallel computing framework in R.....just to get the feel of parallelisation......
Introduction to packrat package:Dependency Management system for R
Packrat is an R package that implements a dependency management system for R:
Maintains two components of your project:
The project private library, containing R packages your project is using, and
The last ‘snapshotted’ state, which can be used to save and restore the state of the private library.
Packrat enhances your project directory by storing your package dependencies inside it, rather than relying on your personal R library that is shared across all of your other R sessions. Packrat lets you snapshot the state of your private library, which saves to your project directory whatever information packrat needs to be able to recreate that same private library on another machine.
Data Analysis for Life Sciences 3_Statistical Inference and Modeling for High-throughput Experiments PH525.3x
This is the third MOOC in the PH525x series - Biomedical Data Science offered by HarvardX on edX. I have tried to capture the entire offering in the markdown as a single document.
Data Analysis for Life Sciences 2 Introduction to Linear Models & Matrix Algebra
This is the second MOOC in the PH525x series - Biomedical Data Science offered by HarvardX on edX. I have tried to capture the entire offering in the markdown as a single document.
Categorical Data Visualisation project final
This is just a big mashed up effort to deal with data which has lot of categorical variables along with number of missing values.This is just an attempt to gain some comfort level while visualising various plots by grouping them according to levels of the categorical variable.Its a work in progress......
IBM Stock prices Forecasting:Univariate Analysis_Eviews
This is an analysis covering basics of univariate time series analysis using Eviews.
Data Analysis for Life Sciences 1 Statistics and R_HarvardX PH525.1x
This is the first MOOC in the PH525x series - Biomedical Data Science offered by HarvardX on edX. I have tried to capture the entire offering in the markdown as a single document.
Simple Linear Regression Presentation
This is a demo presentation about basics of Simple Linear Regression
High quality plots using base R graphics
This is an Interactive tutorial to introduce basic to intermediate plotting capabilities of base R graphics.
The codes here are entirely reproduced from here: https://gist.github.com/noamross/027e1f63343ba223b9cb
Week 1 Assignment:Simple Linear Regression
This is the week 1 module assignment on Simple Linear Regression consisting of answers .This forms part of the MOOC on Coursera: Econometrics: Methods and Applications offered by Erasmus University Rotterdam.
Assignment3 CAEA_SavitaKulkarni Normal Prob Distribution _R
This is detailed document covering various aspects of Normal distribution and various functions in R to deal with it. Visualising the distribution is the best way to understand and interpret a probability distribution and hence graphing of many aspects of normal distribution was generously dealt with here.
Time series plotting in R example of CMIE data
This is a rudimentary example of plotting time series data of stocks .Here use of lubridate as well as manipulate package is shown .
Salary Exploration of faculties in US Univ using R
This is just the basic exploration of the salaries of US Universities faculties .
Assignment2_CAEA_SavitaKulkarni_R
Assignment 2: Installing/Loading packages and some basic descriptive statistics

Central Limit Theorem using Shiny
This shiny pitch is intended to display the Central Limit Theorem (CLT) in the Coursera's Developing Data Products module using Slidify

Central Limit Theorem using Shiny
This shiny pitch is intended to display the Central Limit Theorem (CLT) in the Coursera's Developing Data Products module using R presentation
Assignment1_CAEA_SavitaKulkarni_R
This is the first assignment of the Certificate in Computer Applications in Economic Analysis(CAEA) offered by Gokhale Institute of Politics & Economics(GIPE),Pune.Thisis a basic exploratory analysis of the data set
The_Analytics_Edge edX MIT15.071x June2015_6 Unit 7: Visualization
These are the detailed course notes by Nishant Upadhyay for The_Analytics_Edge_edX MIT15.071x June2015_6 Unit 7: Visualization
The_Analytics_Edge_edX_MIT15.071x_June 2015 Unit6: Clustering
These are the detailed course notes by Nishant Upadhyay for The_Analytics_Edge_edX_MIT15.071x_June2015 Unit6: Clustering.
The_Analytics_Edge_edX MIT15.071x June2015 Unit 5: Text Analytics
These are the detailed course Notes by Nishant Upadhyay for The_Analytics_Edge_edX MIT15.071x June2015 Unit 5: Text Analytics
Goodness of Fit test:Chi-square_example to demonstrate formula & functions In R
Simple demo of Chi-square Goodness of Fit test in R
Introduction to Statistics for Social Sciences_Peer Assignment
This is the peer assignment of Coursera's Introduction to Statistics for Social Sciences by Marco Steenbergen. This assignment being open ended in terms of research question and statistical test to be employed, I used the Chi-square test on Austin City Limits dataset.
The_Analytics_Edge_edX MIT15.071x June2015 Unit4:Trees
These are the detailed course Notes by Nishant Upadhyay for The_Analytics_Edge_edX MIT15.071x June2015 Unit4:Trees .
The_Analytics_Edge_edX MIT15.071x June2015 Unit 1 & 2
Course Notes for the The_Analytics Edge edX MIT15.071x_June2015 Unit 1: An Introduction to Analytics & Unit 2: Linear Regression.
The_Analytics_Edge_edX_MIT15.071x Unit3: Logistic Regression
Course Note for Unit 3:Logistic Regression of edX's The Analytics Edge_MIT offering June 2015
