Recently Published
Convert Square Meters to Square Feet
First RStudio Cloud Test
Keras - First Test Demo
The Fashion MNIST dataset
https://tensorflow.rstudio.com/keras/articles/tutorial_basic_classification.html
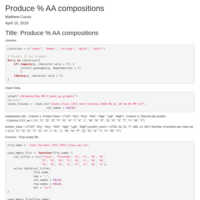
Produce % AA Composition
From small test harness sample of O2 binding proteins
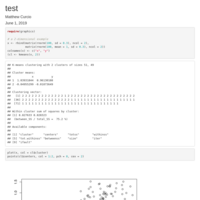
Document test
Kmeans test
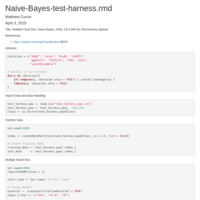
Multiple Caret Run: Naive Bayes, KNN, C5.0 with AA Test-harness dataset
Using `caret` and `caretEnsemble`
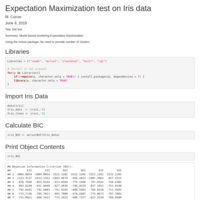
EM test
Title: EM test
Summary: Model based clustering:Expectation Maximization
Iris-caret-6ML-models
KNN=modelknn, C50=modelc50, SVMR=modelSvm, NB=modelnb, CART=modelCart, LDA=modellda
Feature_Selection_Using_Caret
* Calculate correlation matrix
* Find attributes that are highly corrected (ideally > 0.75)
* Learning Vector Quantization (LVQ) model
* Construct an Learning Vector Quantization (LVQ) model. The varImp is then used to estimate the variable importance, which is printed and plotted.
* Estimate variable importance using filterVarImp
* Recursive feature selection
Random-Forest-of-AA-on-Test-Harness-w-Scale-Center
Random forest using 7 x 500 test-harness with 5 x 10 fold cross-validation.
Produce_Single_AA_Percent_Composition_For_Test-Harness.rmd
Take a test-harness (randomly sampled file of protein classes) and produce the percent amino acid composition from the proteins listed. In this case there are 3500 proteins.
Alt-500-Test-Harness.rmd
This program samples 500 polypeptides from each of the files and combines them into a test-harness file. This test harness file (4MB) is much smaller than if I were to run the full dataset of 27MB.
EDA-Part2-Oxygen-binding.rmd
A. Plot of Variances (x 10^5) Vs Amino Acid Type
B. Plot of Means (% of Total) Vs Amino Acid Type
EDA-Part1-Oxygen-Binding-Proteins
One important question which I would like to answer with this exploratory
data analysis, is this data set sufficient to successfully classify the seven classes of protein using a Random Forest machine learning approach?
Fibonacci Numbers
What is Fib(37)?
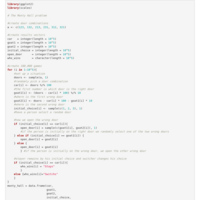
The Monty Hall Problem
Who Wins?
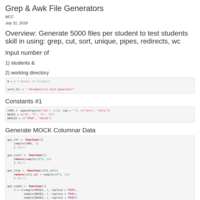
cli_test_generator
Produces 5000 files in the FASTA format then compresses them into a bz2 archive. This program will be the basis for producing all CLI Tests for any number of students.
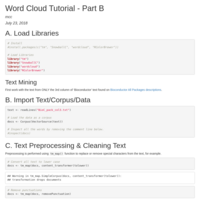
Bioconductor TM
See: https://rpubs.com/oaxacamatt/R-cran-TM
This notebook is a continuation from part A which looks at the words from R-cran and does analysis on them. However this notebook looks at the words from Bioconductor packages. We will then take the output from these two sets of data and do a simple set comparison, looking A intersect B, A-B and B-A.
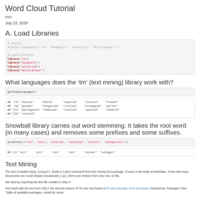
Text mining R-cran Descriptions - Part A
## Text mining R-cran
Work with the text from ONLY the second column of 'R-cran' text found on [R-cran package short description](https://cran.r-project.org/)
followed by 'Packages' then 'Table of available packages, sorted by name'
For Part B see: https://rpubs.com/oaxacamatt/Bioconductor-TM
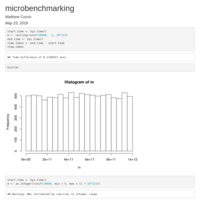
Microbenchmarking for a random number generator
The take home message is that 'ceiling' is better than 'as.integer' due to the fact that 'as.integer' returns NAs by coercion.
Also using 'ceiling' is slightly faster. ;)
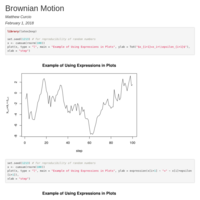
Plotting with Expressions in Labels
Brownian Motion
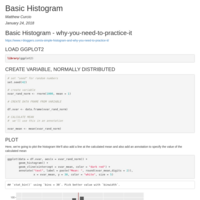
Basic Histogram
Basic Histogram - you need to practice this, using GGplot.
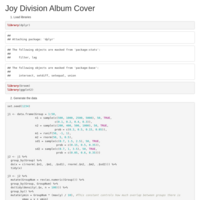
Joy Division - Unknown Pleasures Album cover
I found this script on Rbloggers.com and I liked it and tweaked it a little bit.
Publish Document
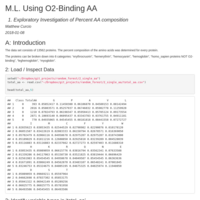
title: "M.L. Using O2-Binding AA"
subtitle: "1. Exploratory Investigation of Percent AA composition"
author: "Matthew Curcio"
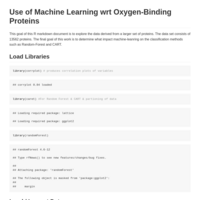
Use of Machine Learning wrt Oxygen-Binding Proteins
This module uses Random Forest against the %AA composition (using 20AA Not Dipeptides) of Oxygen binding proteins to predict classification
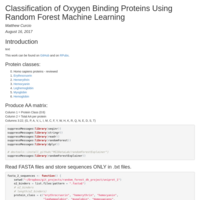
Random Forest Investigation
This is the first portion of my oxygen binding proteins machine learning project. This portion only displays the random forest generation using the percent amino acid composition.
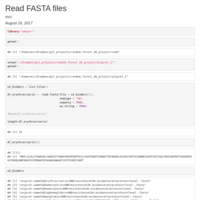
O2 Binders
This is the start of my project to ??
first step produce data frames of o2 binders.
04_10_eQTL
This does not give the same values as the script produced by J Leek.
JLeek_GLM 3_14
"GLM_3_14_pvalues_multiple_testing"
coursera_genomics_stats_wk2_quiz_ques5
What is the dimension of the residual matrix, the effects matrix and the coefficients matrix?
coursera_genomics_stats_wk2_quiz_ques4
Linear Regression Modelling
coursera_genomics_stats_wk2_quiz_ques2
Set the seed to 333 and use k-means to cluster the samples into two clusters. Use svd to calculate the singular vectors.
coursera_genomics_stats_wk2_quiz_ques4
Linear Models with Indicator variable for M sex.
coursera_genomics_stats_wk2_quiz_ques3
Linear Models
coursera_genomics_stats_wk2_quiz_ques1
Singular Value Analysis and Percent Variance
Quiz Wk 1, Question #9
Statistics for Genomic Data Science
Coursera Bioconductor Quiz 2
Epigenomics roadmap data
Bioconductor for Genomic Data Science, Quiz 1
Coursera
author: "MCC"
date: "September 30, 2016"
Model fitting for an interesting puzzle
See: https://youtu.be/i4VqXRRXi68
Example 1 of Sentiment Analysis Using Natural Language Processing
This example sentiment analysis uses Natural Language Processing (NLP) using R and the library TM (text mining package, https://cran.r-project.org/web/packages/tm/). The corpus uses 81 job postings using the key words, computation biology or bioinfromatics from http://www.biospace.com.
Quantitative Genetics, HW #2, Question #3
This is an attempt to answer HW 2 question #3
