
owejessen
Owe Jessen
Recently Published

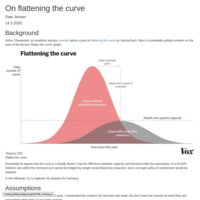
On flattening the curve
Arthur Charpentier, an academic actuary, tweeted about a post on flattening the curve by Joscha Bach. Bach is essentially putting numbers on the axes of the famous ‘flatten the curve’ graph. Essentially he argues that the curve is a lie, that the difference between capacity and demand under the assumption of a 40-60% infection rate within the next year just cannot be bridged by simple social distancing measures, and a stronger policy of containment would be required.
In the following I try to replicate his analysis for Germany.

Some thoughts on COVID-19 - Version 2
Version 2 of my blog post on COVID-19
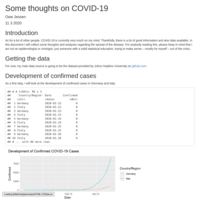
Some thoughts on COVID-19
As for a lot of other people, COVID-19 is currently very much on my mind. Thankfully, there is a lot of good information and also data available. In this document I will collect some thoughts and analyses regarding the spread of the disease. For anybody reading this, please keep in mind that I am not an epidemologist or virologist, just someone with a solid statistical education, trying to make sense – mostly for myself – out of the crisis.
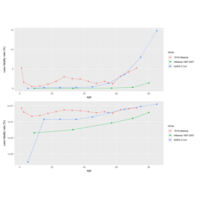
Comparison of Spanish flu, Influenza 1997-2007 and SARS-2-CoV
The purpose of the plot is to show the difference in plotting with and without a log scaled y-axis.
Original data: https://github.com/jbloom/CoV_vs_flu_CFR/blob/master/cfr_stats.ipynb
Inspired by:
https://twitter.com/jbloom_lab/status/1234589518700871680?s=20