
paul4forest
Rougieux
Recently Published
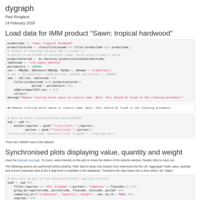
dygraph
Use the dygraph package to display time series of forest products trade data
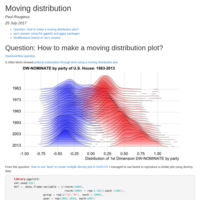
How to make a moving distribution plot?
Plot changes of distribution through time, with overlapping humps.
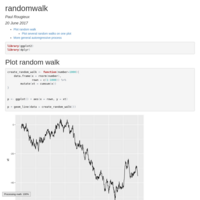
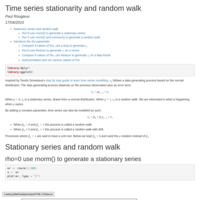
Random Walk and autoregressive process
x_t follows a data generating process based on the normal distribution. The data generating process depends on the previous observation plus an error term: x_t = rho x_{t-1} + e_t
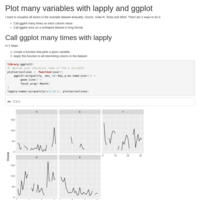
Plot many variables with lapply and ggplot
I want to visualise all series in the example dataset airquality: Ozone, Solar.R, Temp and Wind. There are 2 ways to do it:
Call ggplot many times on each column name
Call ggplot once on a reshaped dataset in long format

Rtutorial
tuto
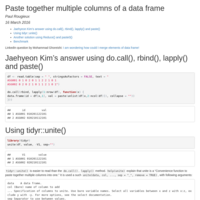
How to merge columns of a data frame
Reply to a LinkedIn R group question.
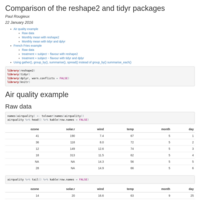
Comparison of the reshape2 and tidyr packages
Use the Air quality example and French Fries example to compare the usage of reshape2 melt() and dcast() functions to tidyr gather() and spread() functions combined with the dplyr group_by() and summarise() functions.
Jerry Seinfeld’s Productivity Secret
Don't break the chain
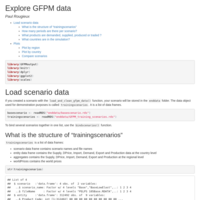
GFPMoutput to explore GFPM simulations
GFPMoutput is a an R package that converts DAT files output of GFPM PELPS folders (see http://labs.russell.wisc.edu/buongiorno/welcome/gfpm/) into data frame structures. The GFPMouput package can be used to plot consumption, production and trade volumes for more than 2 scenarios and to automate various calculations such as welfare and value added.
Time Series
Inspired by Tavish Srivastava’s step by step guide to learn time series modelling. Use rnorm() to generate the error and use Reduce(accumulate=TRUE) to calculate a random walk.

ggplot2
Example plot and shading using the GGPLOT2 package
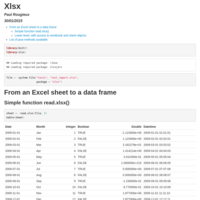
xlsx
Example using the package xlsx to read Excel files.
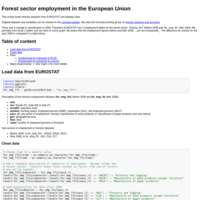
Forest sector employment - EUROSTAT download
This scripts loads forestry datasets from EUROSTAT and displays data.
Original datasets and metadata can be viewed on the eurostat website.