
pawel-wieczynski
pawel-wieczynski
Recently Published
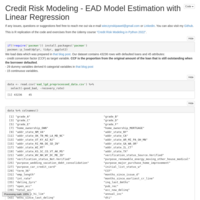
Credit Risk Modeling - EAD Model Estimation with Linear Regression
This is R replication of the code and exercises from the Udemy course “Credit Risk Modeling in Python 2022”. Chapter 12. Fitting linear regression model to predict CCF (credit conversion factor).
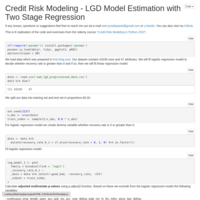
Credit Risk Modeling - LGD Model Estimation with Two Stage Regression
This is R replication of the code and exercises from the Udemy course “Credit Risk Modeling in Python 2022”. Chapter 11. Fitting logistic regression to decide whether recovery rate is greater than 0. If so, then fitting linear regression.
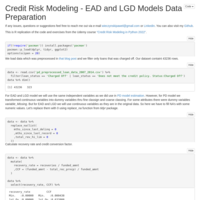
Credit Risk Modeling - EAD and LGD Models Data Preparation
This is R replication of the code and exercises from the Udemy course “Credit Risk Modeling in Python 2022”. Chapter 10. Preparation of data for EAD and LGD models. Filling missing values. Calculating recovery rate and credit conversion factor (CCF).
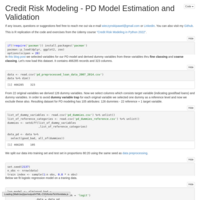
Credit Risk Modeling - PD Model Estimation and Validation
This is R replication of the code and exercises from the Udemy course “Credit Risk Modeling in Python 2022”. Chapter 6 and 7. Fitting logistic regression model to predict probability of default. Calculation of ROC, AUC, Gini Index and Kolmogorov-Smirnov statistic.
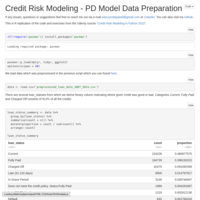
Credit Risk Modeling - PD Model Data Preparation
This is R replication of the code and exercises from the Udemy course “Credit Risk Modeling in Python 2022”. Chapter 5: PD Model Data Preparation. Calculating weight of evidence and information value. Fine classing and coarse classing of discrete and continuous variables.
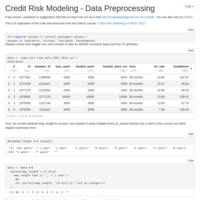
Credit Risk Modeling - Data Preprocessing
This is R replication of the code and exercises from the Udemy course “Credit Risk Modeling in Python 2022”. Chapter 4: General Preprocessing. Data cleansing, class conversion, handling missing values, creating dummy variables.
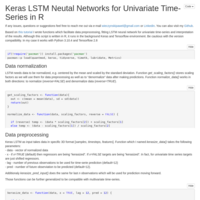
Keras LSTM Neutal Networks for Univariate Time-Series in R
R script which runs in the background Keras and Tensorflow environment. Set of functions for data preprocessing, fitting LSTM neural network for univariate time-series and interpretation of the results.
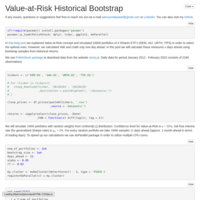
Value-at-Risk Historical Bootstrap
Simulation of ETFs random portfolios. Calculating VaR and cVaR 21-days ahead using bootstrap samples from historical returns. Parallel computation. Visualization of results.
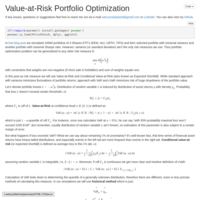
Value-at-Risk Portfolio Optimization
Definition of VaR and cVaR. Simulation of ETFs random portfolios. Calculation of expected return, VaR (historical method) and generalized sharpe ratio. Selecting minimal risk portfolios and maximal sharpe ratio portfolios. Visualization on 2-dimensional risk-return space.
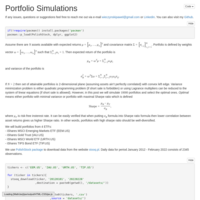
Portfolio Simulations
Simulation of ETFs random portfolios. Calculation of expected return, risk measured by standard deviation and sharpe ratio. Selecting minimal variance portfolio and maximal sharpe ratio portfolio. Visualization on 2-dimensional risk-return space.
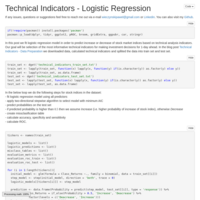
Technical Indicators - Logistic Regression
Fit logistic regression model in order to predict increase or decrease of stock market indices based on technical analysis indicators.
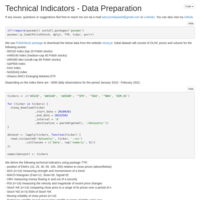
Technical Indicators - Data Preparation
Downloading asset prices, calculation of technical indicators, splitting data into training set and test set. In further blog posts we will try different classification algorithms in order to predict increase or decrease of the close prices using technical indicators. Our goal will be selection of the most informative technical indicators for making investment decisions.
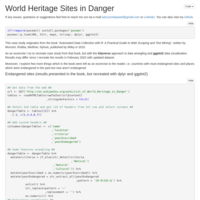
World Heritage Sites in Danger
This case study originates from the book "Automated Data Collection with R: A Practical Guide to Web Scraping and Text Mining". As an exercise I try to recreate case study from that book, but with the tidyverse environment. Moreover, I explore few more things which in the book were left as an exercise to the reader, i.e. countries with most endangered sites and places which were endangered in the past but now aren't endangered.
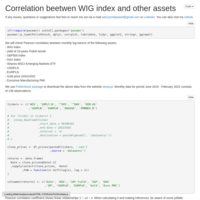
Correlation beetwen WIG index and other assets
Automatized downloading stock data. Correlation between WIG and other indices and assets. Calculation and visualization of moving correlation.
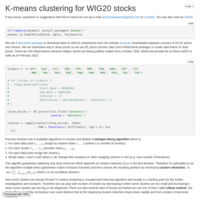
K-means clustering for WIG20 stocks
Automatized downloading stock data. Explained Hartigan-Wong algorithm for k-means clustering, choosing optimal number of clusters using elbow method. Indication of possible changes which could affect obtained results, e.g. different measures, different centroids, different attributes.