
pjozefek
Paul Jozefek
Recently Published
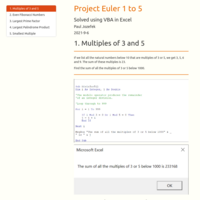
Project Euler 1 to 5
Solved using VBA in Excel
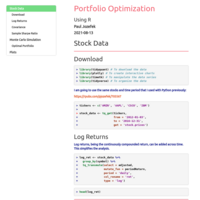
Portfolio Optimization
Monte Carlo simulation to find the optimal portfolio.
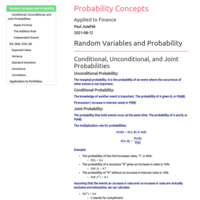
Probability Concepts Applied to Finance
Probabilities, expected value, variance, etc. applied to portfolios
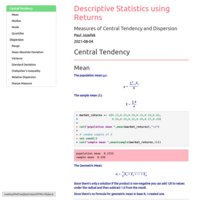
Descriptive Statistics using Returns
Measures of Central Tendency and Dispersion
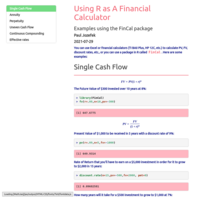
Using R as A Financial Calculator
Examples with the FinCal package.
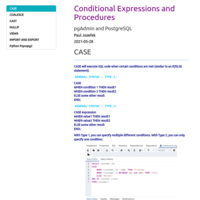
SQL Conditional Expressions and Procedures
PostgreSQL Conditional Expressions and Procedures, Import and Export, Python
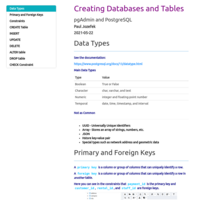
Creating Databases and Tables (SQL)
SQL commands to create databases and tables.
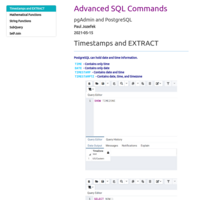
Advanced SQL Commands
A summary of some advanced SQL commands.
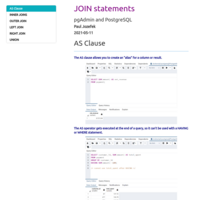
SQL Join Statements
A summary of SQL JOIN statements.
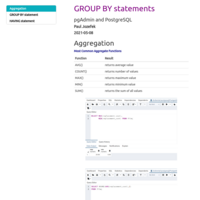
SQL GROUP BY statements
A summary of SQL GROUP BY statements.
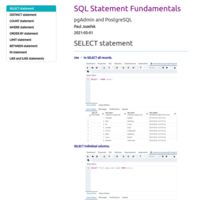
SQL Statement Fundamentals
A summary of frequently used SQL statements.
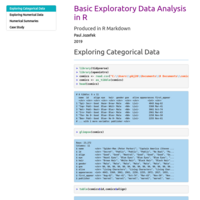
Basic Exploratory Data Analysis in R
Basic Exploratory Data Analysis in R from 2019
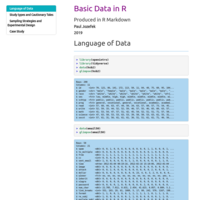
Basic Data in R
Some basic work from 2019
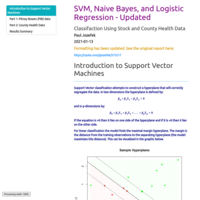
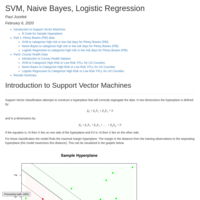
SVM, Naive Bayes, Logistic Regression - Updated
Support Vector Machine, Naive Bayes, and Logistic Regression classifiers with stock data and county health data. Updated formatting.
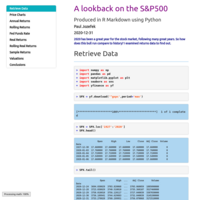
A lookback on the S&P500
Evaluating the S&P 500 returns, the Fed Funds rate, and valuation over time. The period ending 2020-12-31. Using Python.
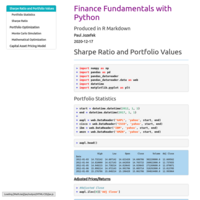
Finance Fundamentals with Python
Portfolio statistics, Sharpe Ratio, Portfolio optimization, Capital Asset Pricing Model
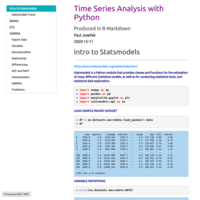
Time Series Analysis with Python
Time series analysis using Python's Statsmodels package. Exponentially-weighted moving averages, error-trend-seasonality decomposition, seasonal ARIMA models.
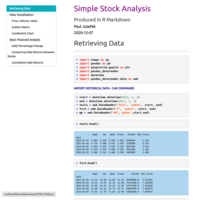
Simple Stock Analysis using Python
Stock visualization and analysis
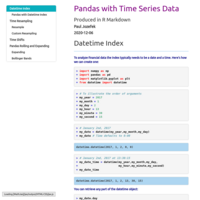
Pandas with Time Series Data
Working with dates using Pandas. Datetime Index, Resampling, Time Shifts, Rolling and Expanding.
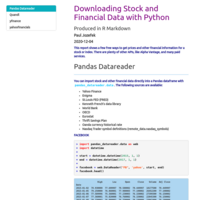
Downloading Stock and Financial Data with Python
A few free ways to get prices and other financial information for a stock or index. Pandas Datareader, Quandl, yfinance, yahoofinancials
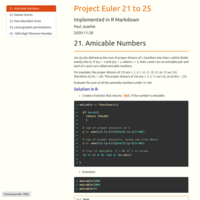
Project Euler 21 to 25
Solutions to Project Euler numbers 21 through 25 using R and Python
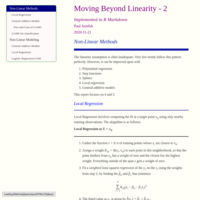
Moving Beyond Linearity - 2
Local regression. General additive models.
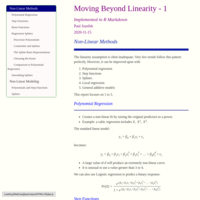
Moving Beyond Linearity - 1
Polynomial regression, step functions, splines
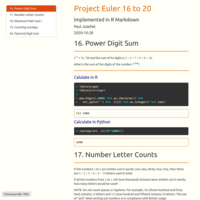
Project Euler 16 to 20
Solutions to Project Euler numbers 16 through 20 using R and Python
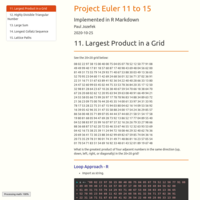
Project Euler 11 to 15
Solutions to Project Euler numbers 11 through 15 using R and Python
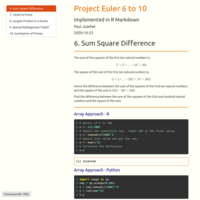
Project Euler 6 to 10
Solutions to Project Euler numbers 6 through 10 using R and Python
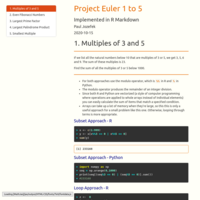
Project Euler 1 to 5
Solutions to Project Euler numbers 1 through 5 using R and Python
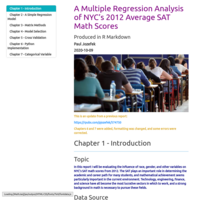
A Multiple Regression Analysis of NYC’s 2012 Average SAT Math Scores
Data wrangling and exploration. Model selection and evaluation. Matrix calculations. Cross Validation. Python implementation.
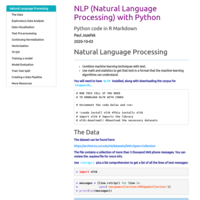
NLP (Natural Language Processing) with Python
NLP using nltk and scikit-learn
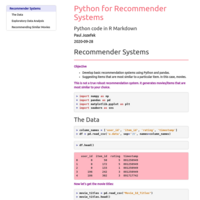
Python for Recommender Systems
Basic recommendation system using Python and pandas.
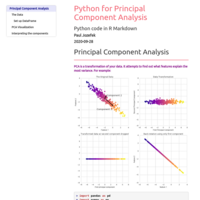
Python for Principal Component Analysis
PCA using scikit-learn
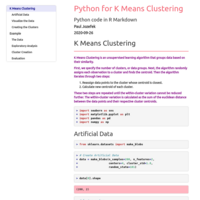
Python for K Means Clustering
K Means Clustering using scikit-learn
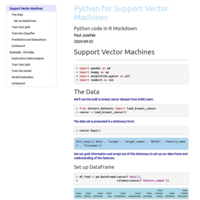
Python for Support Vector Machines
Support Vector Machines using scikit-learn
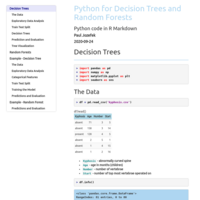
Python for Decision Trees and Random Forests
Decision Trees and Random Forests using scikit-learn
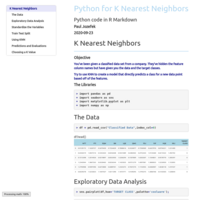
Python for K Nearest Neighbors
K Nearest Neighbors using scikit-learn
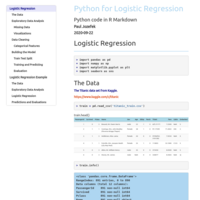
Python for Logistic Regression
Logistic regression using scikit-learn.
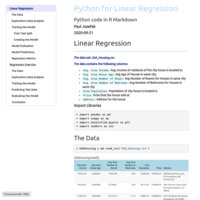
Python for Linear Regression
Linear regression using scikit-learn.
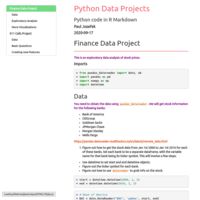
Python Data Projects
An exploratory data analysis of stock prices and an analysis of 911 call data from Kaggle
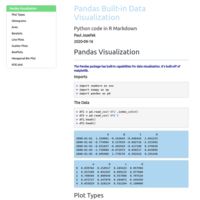
Pandas Built-in Data Visualization
Plots called directly from Pandas dataframes
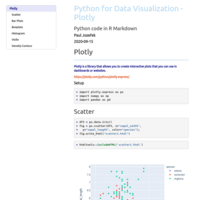
Python for Data Visualization - Plotly
Interactive plotly charts - scatter, bar plots, boxplots, histogram, violin, density contour
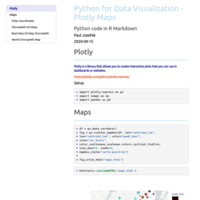
Python for Data Visualization - Plotly Maps
Plotly maps, Polar Coordinates, Choropleth maps
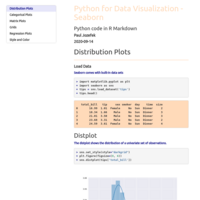
Python for Data Visualization - Seaborn
distribution plots, categorical plots, matrix plots, grids, regression plots
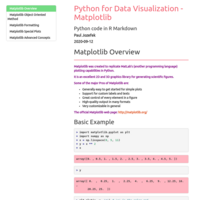
Python for Data Visualization - Matplotlib
Matplotlib plots and formatting.
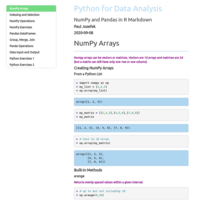
Python for Data Analysis - NumPy and Pandas
NumPy - Arrays, Indexing and Selection, Operations.
Pandas - Series, DataFrames, Grouping, Joining, and Merging, Operations, Input and Output.
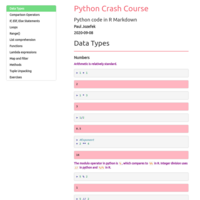
Python Crash Course
Some Python basics, like If statements, loops, functions, lists, tuples, dictionaries, mapping, filtering, etc.
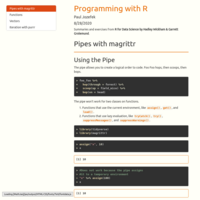
Programming with R
Pipes, Functions, Vectors, and Iteration
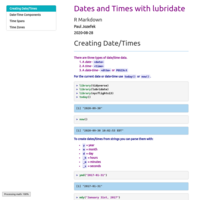
Dates and Times with lubridate
Creating Date/Times, Date-Time Components, Time Spans, Time Zones
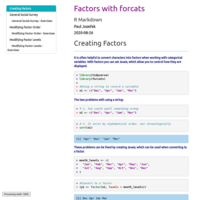
Factors with forcats
Creating factors, modifying factor order, modifying factor levels
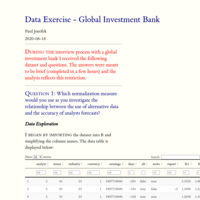
Data Exercise - Global Investment Bank
A short analysis on the impact of alternative data on sell-side earnings estimates.
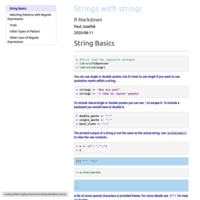
Strings with stringr
String basics & matching patterns with regular expressions - anchors, repetition, grouping, detecting, extracting, replacing, splitting, locating, etc.

Tidying Data with tidyr
Pivoting Longer (Gathering), Pivoting Wider (Spreading), Separate, Unite, Missing Values, Case Study
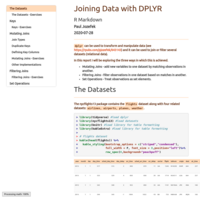
Joining Data with dplyr
mutating joins (inner, left, right, full), filtering joins (semi, anti), and set operations (intersect, union, setdiff)
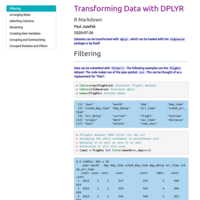
Transforming Data with dplyr
Filtering, Arranging, Selecting, Renaming, Creating, Grouping, and Summarizing with dplyr
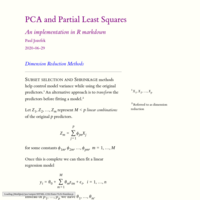
Principal Components Analysis and Partial Least Squares
An overview of PCA and PLS with examples.
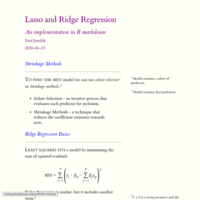
Lasso and Ridge Regression
Summary of Lasso and Ridge Regression with examples
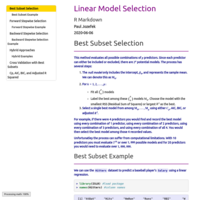
Linear Model Selection
Linear model selection methods - best subsets, forward, backward, sequential replacement. Overview of selection metrics - Cp, AIC, BIC, adjusted R squared.

Resampling Methods
A review of resampling methods with examples using the `boot` package.
Cross-validation and Bootstrapping.

Applying a GARCH model to RCL (Updated)
This is an updated report to account for the initial impacts from COVID-19
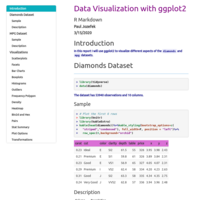
Data Visualization with ggplot2
Scatter Plots, Bar Charts, Histograms, Density Plots, Box Plots, Heat Maps, Facets grids, Frequency Polygons, Pairs, Stat Summaries, Transformation
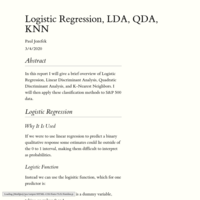
Logistic Regression, LDA, QDA, KNN
In this report I give a brief overview of Logistic Regression, Linear Discriminant Analysis, Quadratic Discriminant Analysis, and K-Nearest Neighbors. I then apply these classification methods to S&P 500 data.
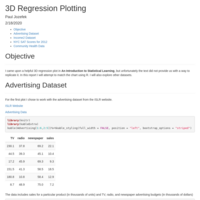
3D Regression Plotting
Regression plots with two independent variables. Includes a fitted regression plane.

A Multiple Regression Analysis of NYC’s 2012 Average SAT Math Scores
Data exploration. Model selection and evaluation. Matrix calculations. Cross Validation.
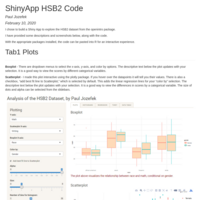
A ShinyApp to explore the HSB2 dataset
Screenshots and code for a ShinyApp. Interactive Boxplots, Scatterplots, Histograms, and Regression Plots. Tukey’s HSD Test. Data Table.

Applying a GARCH model to Royal Caribbean International (RCL)
Estimating RCL's volatility with a GARCH model. ACF and PACF review. Model selection. Diagnostics. Forecasting.
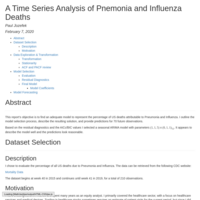
A Time Series Analysis of Pnemonia and Influenza Deaths
Using a SARIMA model to evaluate Pnemonia and Influenza data. Data transformation. ACF and PACF review. Model selection and diagnostics. Forecasting.
SVM, Naive Bayes, Logistic Regression
Support Vector Machine, Naive Bayes, and Logistic Regression classifiers with stock data and county health data.