
pkageliza
Pamella Kageliza
Recently Published
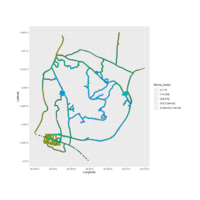
Dose_rates
#create the five levels
Mrima_levels<-cut(Mrima_sf$dose,breaks=c(0,114,228,570,2293,5144))
#assign color code to the levels
palette=c(Mrima_levels, seecol(pal_signal,n=5))
#Use the five levels and palette created to create a discrete map
ggplot(Mrima, mapping=aes(x=lon,y=lat))+geom_sf(data=Mrima_sf, inherit.aes = FALSE)+
geom_point(aes(colour=Mrima_levels),alpha=0.6, size=1)+
scale_color_manual(values=palette, aesthetics =c("colours", "fill") , breaks=waiver())+
ylab("Latitude")+xlab("Longitude")