
pouyadini
Pouya
Recently Published
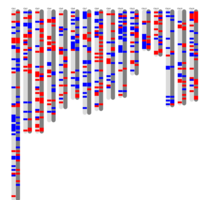
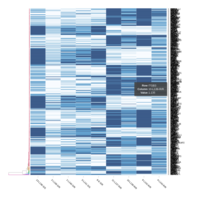
Figure 2.B_PNAS
Distribution of monoallelically expressed genes across equine chromosomes (top). A total of 1,111 genes were located on autosomal chromosomes. ECA1 had the largest number of MAE genes among the autosomal chromosomes followed by ECA10, ECA3 and ECA7. A binomial test showed that there were biases in the proportion of maternal and paternal genes (toward one of the parents) in chromosome on ECA3 and ECA10. Ideogram with the genomic map of the monoallelically expressed genes (bottom). Distribution of paternally and maternally expressed genes are demonstrated based on the strand of their transcription. The ideogram was generated using Package ‘ChromoMap’ in R (62). Gene names can be found in the interactive ideogram at https://rpubs.com/pouyadini/594229
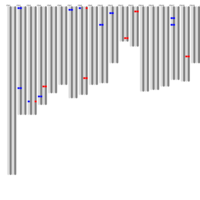
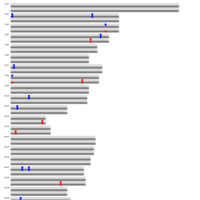
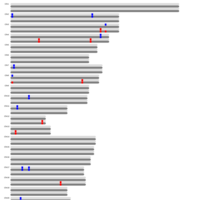

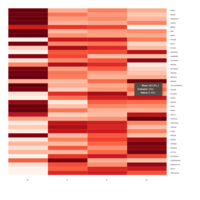
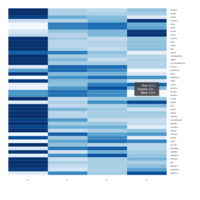
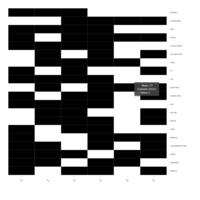
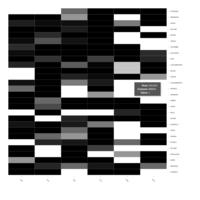
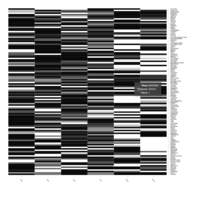
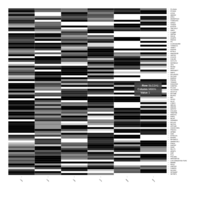
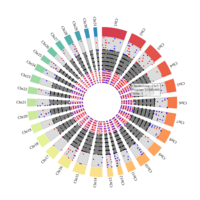
Figure 4.A_PNAS
A. Circos plot of data curation to identify imprinted genes. The list of genes with significant methylated cytosines, corresponding to 2,894 autosomal genes were compared to the list of the MAE genes (n = 1,111) . A total of 254 genes were both monoallelically expressed and methylated (imprinted). Gene names can be found in the interactive circus plot at https://rpubs.com/pouyadini/568876
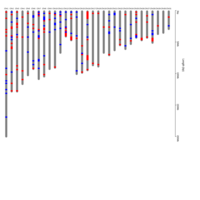
Figure 4.B_PNAS
B. Ideogram showing distribution of imprinted genes on equine chromosomes. Gene names can be found in the interactive ideogram at https://rpubs.com/pouyadini/568783
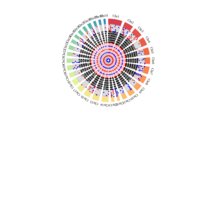

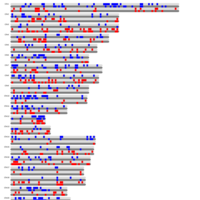
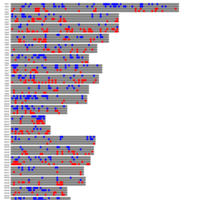
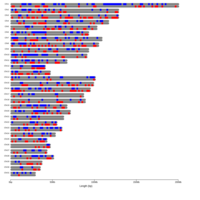


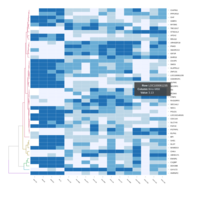
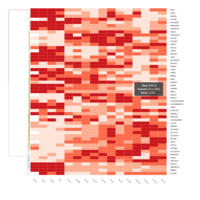
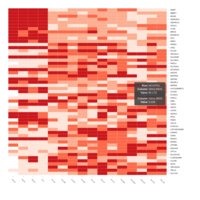
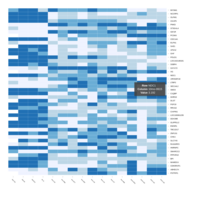
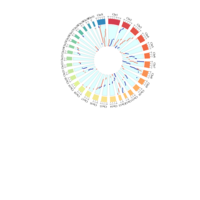
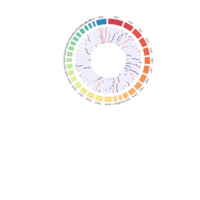
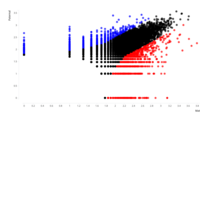
Figure 1.A_PNAS
A. Number of informative SNPs in monoallelic and bi-allelic expressed genes (each dot represents a gene). A binomial test was used to detect statistically significant deviations between number of maternal and paternal SNPs for each gene. Multiple testing-corrected p-values were calculated by the false discovery rate method (Benjamini and Hochberg – FDR < 0.05). To identify the significant MAE genes, we used a cutoff of maternal expression (Mat) > 75% and paternal expression (Pat) < 25% for maternally expressed candidates (red dots) and Mat < 25% and Pat > 75% for paternally expressed ones (blue dots). Black dots represent the bi-allelically expressed genes. The scatter plot of the MAE genes was generated using Package `taucharts` in R. The log (number of SNPs +1) is represented in the x- and y-axes. Gene names can be found in the interactive scatter plot at https://rpubs.com/pouyadini/545723
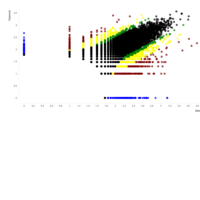
Figure 1.B_PNAS
B. Groups of monoallelic expressed genes based on four different cutoff points for detection of parental bias (each dot represents a gene). MAE genes were grouped and presented in four groups based on the parental bias in their expression (Group A; 100% [n=269 Mat and 163 Pat genes], Group B; 100 > - 90% [n=277 Mat and 139 Pat genes], Group C; 90 > - 80% [n=393 Mat and 340 Pat genes], and Group D; 80 > - 75% [n=218 Mat and 233 Pat]). Gene names can be found in the interactive scatter plot at https://rpubs.com/pouyadini/545721 . Dots are colored by grouping rather than by parent-of-origin.
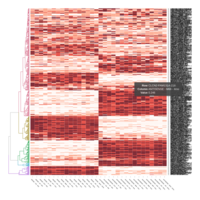
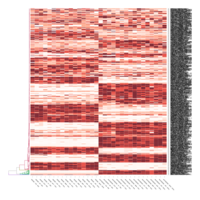
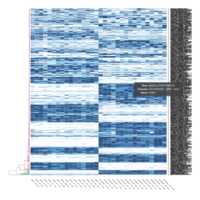
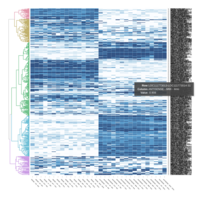
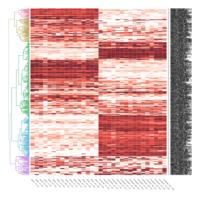
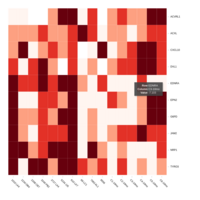

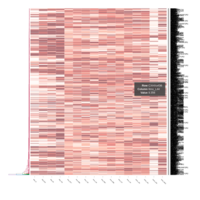
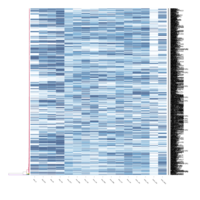
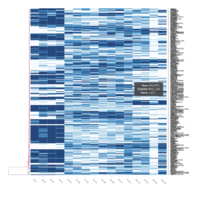
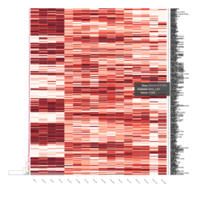
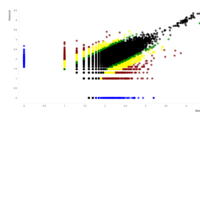


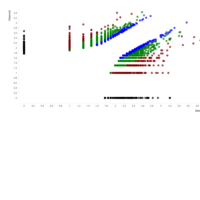
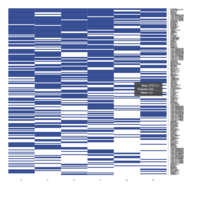
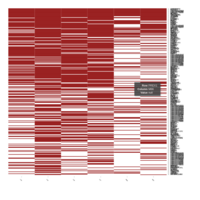
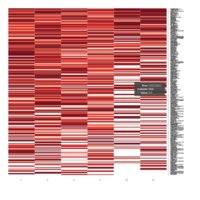
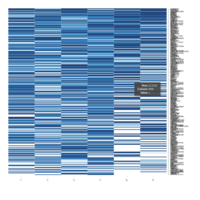
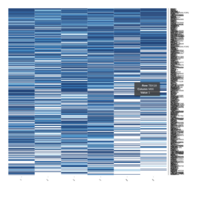
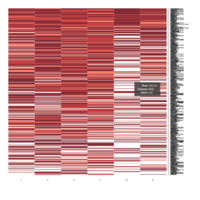
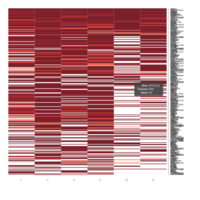
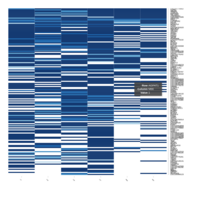
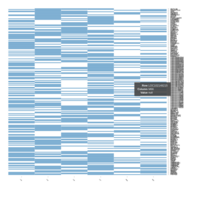
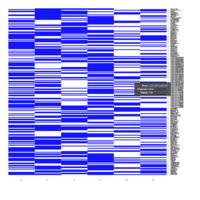
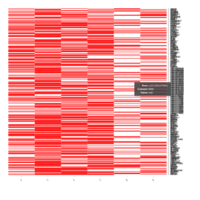
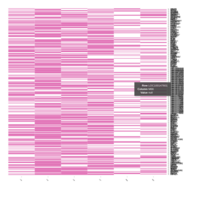
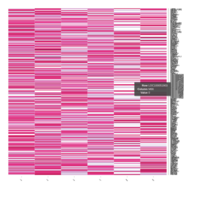
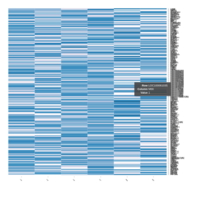
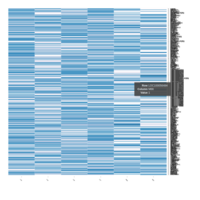
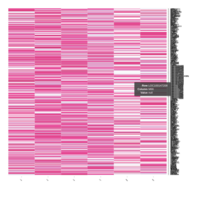
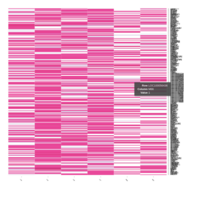
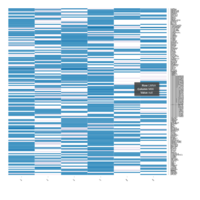

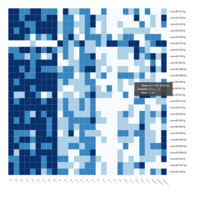

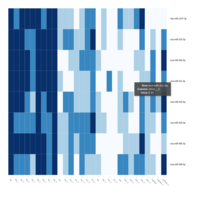
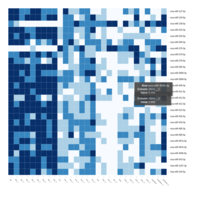
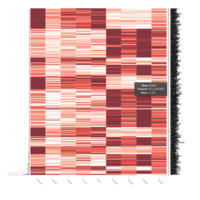
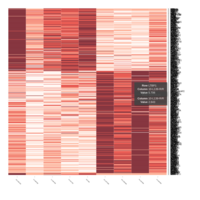
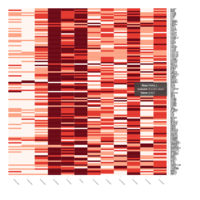
FIG 11. A.
Differential gene expression and weighted gene co-expression network analysis in stallions homozygous and heterozygous for the CXCL16S allele (CXCL16S/CXCL16S and CXCL16S/CXCL16R; n=5). (A) A total of 542 genes were differentially expressed between animals exhibiting different genotype (i.e. between stallions carrying the susceptibility allele [CXCL16S, n=5] and those who did not [homozygous for CXCL16R, n=4]) and following EAV infection. A lower proportion (188 genes) were upregulated in stallions carrying the CXCL16S allele.
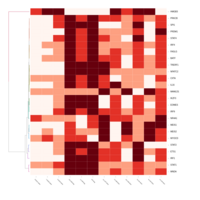
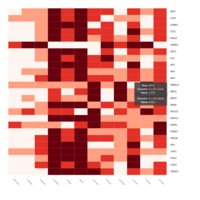
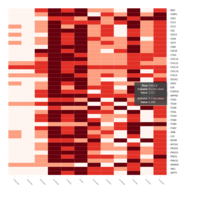
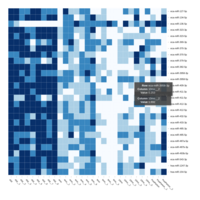
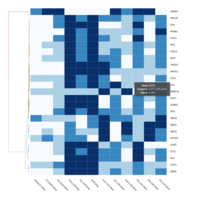
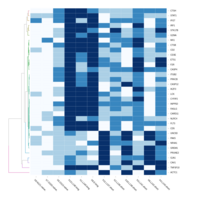
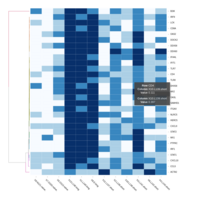
FIG 3. B. Transcription Factors
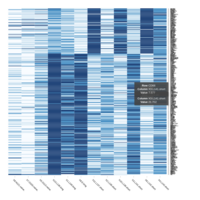
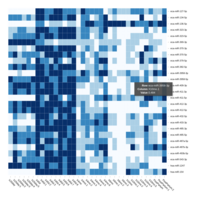
Representative heatmaps showing perturbation in the gene expression of several transcription factors
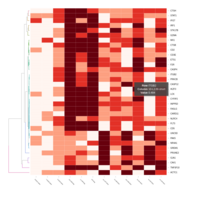
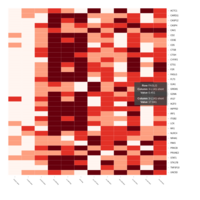
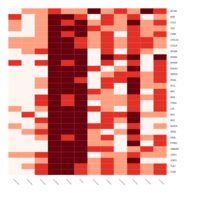
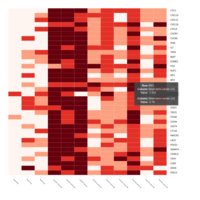
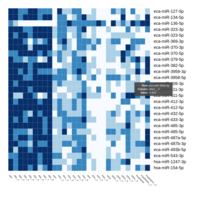
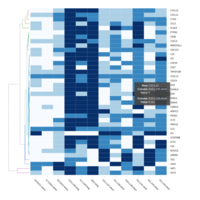
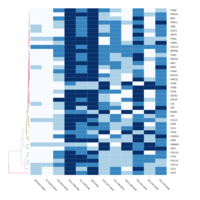
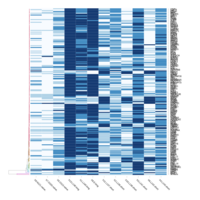
FiG 3. B. Apoptosis
Representative heatmaps showing changes in gene expression levels during long and short-term viral persistence. DEGs (n=390) were classified based on their Gene Ontology (GO) terms and selected categories are depicted. Differential gene expression analysis revealed a significant upregulation of genes involved in apoptosis
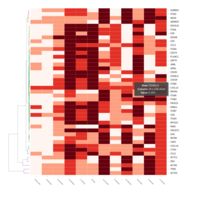
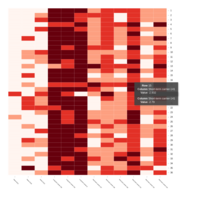
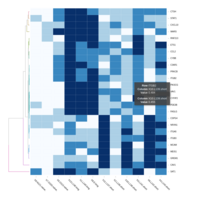
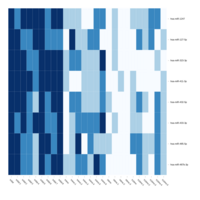
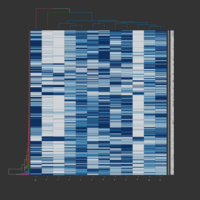
FiG 3. B. Adhesion
Representative heatmaps showing changes in gene expression levels during long and short-term viral persistence. DEGs (n=390) were classified based on their Gene Ontology (GO) terms and selected categories are depicted. Differential gene expression analysis revealed a significant upregulation of genes involved in adhesion
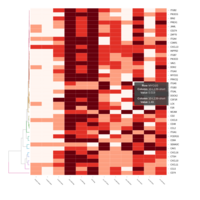
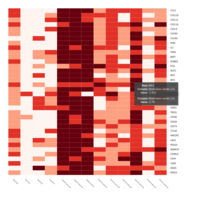
FiG 3. B. Chemotaxis
Representative heatmaps showing changes in gene expression levels during long and short-term viral persistence. DEGs (n=390) were classified based on their Gene Ontology (GO) terms and selected categories are depicted. Differential gene expression analysis revealed a significant upregulation of genes involved in chemotaxis
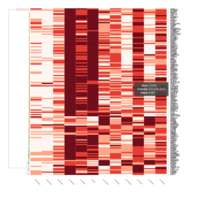
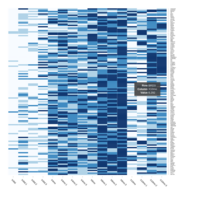
FIG 3. B. Adaptive Immune Responses
Representative heatmaps showing changes in gene expression levels during long and short-term viral persistence. DEGs (n=390) were classified based on their Gene Ontology (GO) terms and selected categories are depicted. Differential gene expression analysis revealed a significant upregulation of genes involved in adaptive immune responses
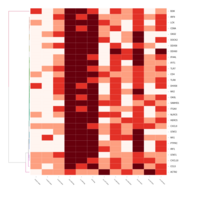
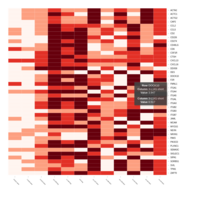
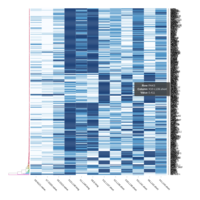
FIG 3. B. Responses to Viral Infection
Representative heatmaps showing changes in gene expression levels during long and short-term viral persistence. DEGs (n=390) were classified based on their Gene Ontology (GO) terms and selected categories are depicted. Differential gene expression analysis revealed a significant upregulation of genes involved in responses to virus infection
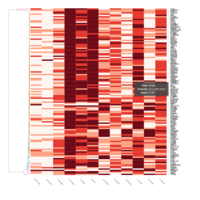
FIG 3. B. Innate Immune Responses
Representative heatmaps showing changes in gene expression levels during long and short-term viral persistence. DEGs (n=390) were classified based on their Gene Ontology (GO) terms and selected categories are depicted. Differential gene expression analysis revealed a significant upregulation of genes involved in innate immune responses
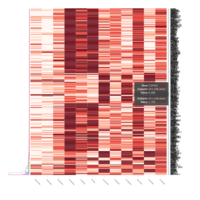
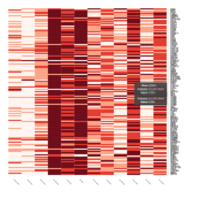
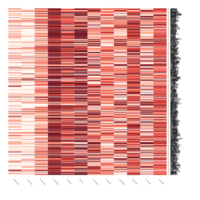
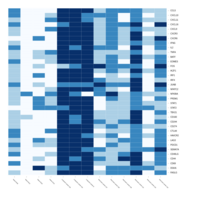
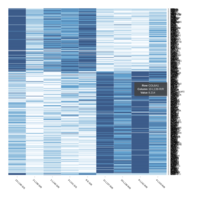
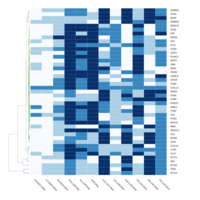
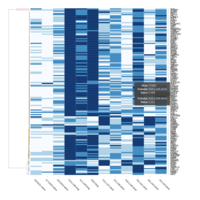
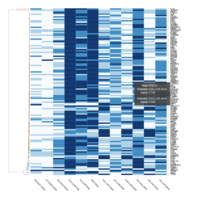
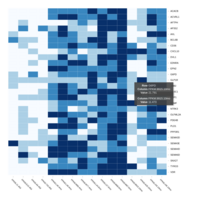
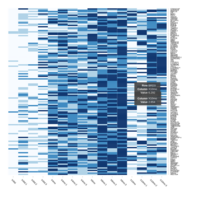
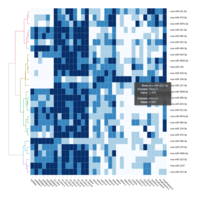
FIG 3. A
Heatmap depicting the expression pattern of the differentially expressed genes (DEGs) between long-term and short-term carrier stallions (n=390 genes). The majority of the DEGs between these two groups were upregulated.
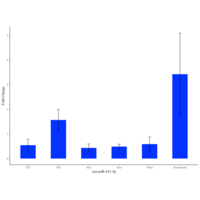
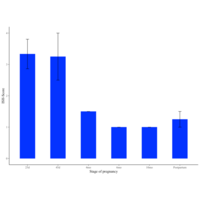
qPCR
MCA_-DCT

SS-SR-RR
SS-SR-RR
C24MC
-DCT

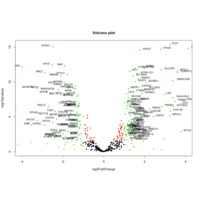
VolcanoPlot- target mRNA-geneName
VolcanoPlot- target mRNA-geneName
34Day whole embryo-2 Postpartum placenta
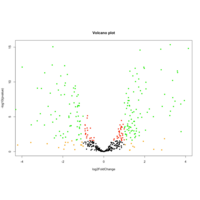
VolcanoPlot- target mRNA
34Day whole embryo-2 Postpartum placenta
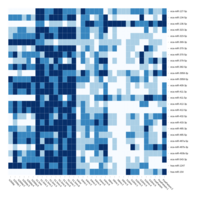
C14MC, CAM, -DCT -A
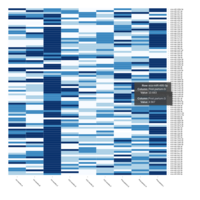
Dendrogram none
C14MC, CAM, -DCT -B
Dendrogram row
C14MC, CAM, -DCT -C
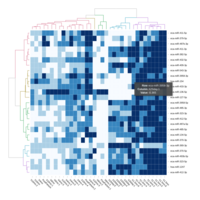
Dendrogram Both
HTML
CAM - Normalized Read Count -