
pwjones
Phillip Jones
Recently Published
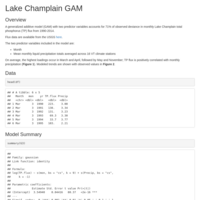
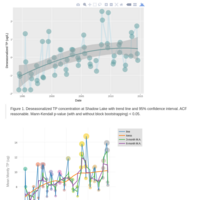
GAM: Lake Champlain TP Flux
Generalized Additive Model applied to LC TP Flux
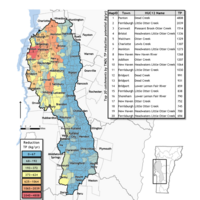
Cartographic example II
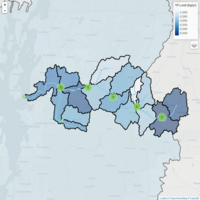
Potential TMDL target reductions downscaled to NHD+ catchment scale.
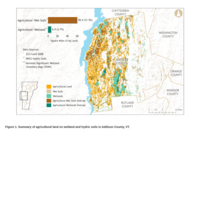
Cartographic example I
Breakdown of agricultural lands on wetland and hydric soil series, Addison County, VT, USA.
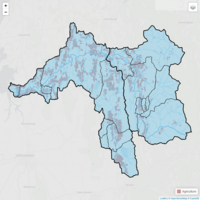
Lewis Creek Leaflet
Interactive map display showing NHD+ catchment summaries of LCBP 1m resolution agricultural landcover classes.
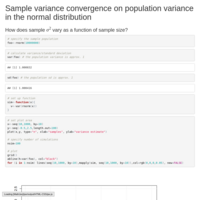
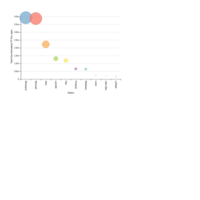
Sample variance convergence
How does sample variance converge on population variance as a function of sample size?
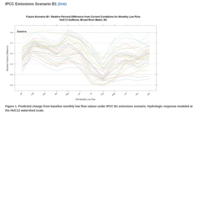
IPCC Scenario B1
Still bad...
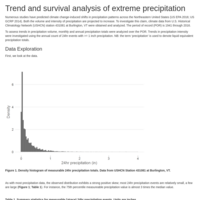
Precipitation Climate Change in Vermont
Trend and survival analysis of precipitation data from Burlington, VT
Dissolved SO4
Interactive NVD3.js rChart: Mean annual dissolved sulfate timeseries. Fixed y-axis and multiple site summary in tool tip.
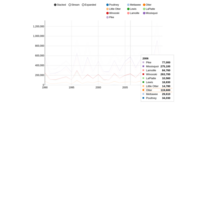
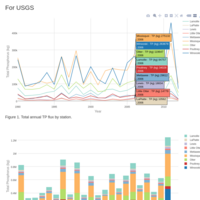
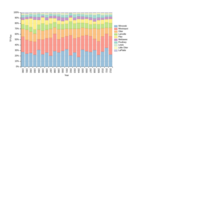
Annual LC TP Flux by Station, Stacked Area and % Total
Interactive NVD3.js chart created in R. Scalable y-axis, interactive guideline and multiple tooltips. Data source: http://pubs.usgs.gov/of/2014/1209/
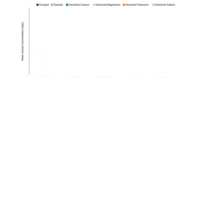
Base Cations
Interactive NVD3.js rChart: Mean annual base cation concentration.
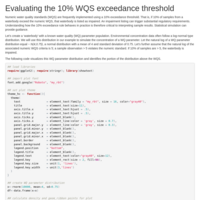
Evaluating the 10% WQS exceedance threshold
How sampling regime impacts Type I error under the 10% WQS exceedance threshold rule.
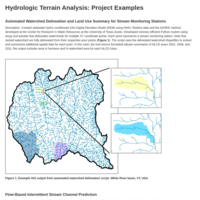
Hydrologic Terrain Analyses
Examples of recent projects
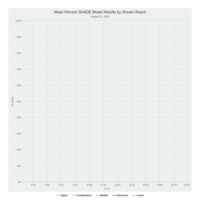
Stream Thermal Modeling: SHADE Model Results
Input for QUAL2kw stream model. Highcharts figure.
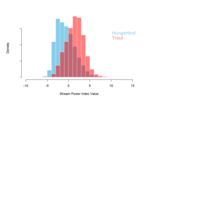
HUC12 Stream Power Index
Comparison of 1.6m LiDAR-derived Stream Power Index values for two HUC12 watersheds
fitted/observed
SWAT/USGS TP Flux estimates, Lamoille Basin
LC TMDL Flux
To share with USGS
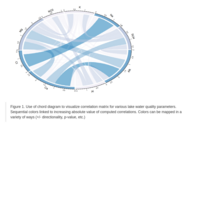
Chord diagram of various lake water quality parameters
Useful alternative to heatmap for visualizing correlation matrices.
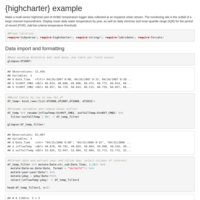
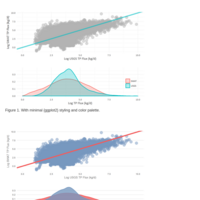
Various interactive plots produced with plotly.js.
Interactive line/scatter/density figures for environmental data. Created in R. Includes ggplot2 conversion example + native plotly.js formats.
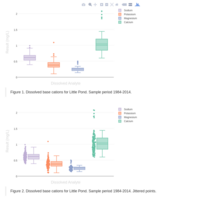
Various interactive plotly.js boxplots created in R.
Lake pH sampling program. Dissolved base cation distributions.
Aggregated SWAT TP Estimates at HUC12 Watershed Scale
Testing out R leaflet's functionality
Sum Flow Normalized TP Flux by Station, 1990-2012
Interactive dimple.js plot created in R. Data source: http://pubs.usgs.gov/of/2014/1209/
Annual Lake Champlain TP Flux by Station, % Total
Interactive dimple.js plot created in R. Data source: http://pubs.usgs.gov/of/2014/1209/
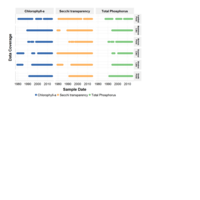
LMP
Custom ggplot2: Data coverage for multiple limnology parameters by sample site