
ramanraja
Rajaraman
Recently Published
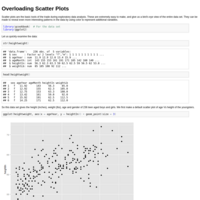
Overloading Scatter Plots
Even a simple scatter plot can be overloaded (in the OOPS sense) with more information through the use of color, shapes etc
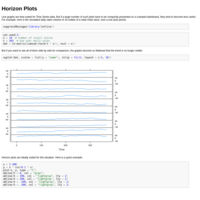
Horizon Plots
Horizon plot tutorial
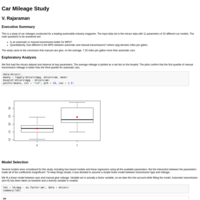
Car Mileage Study
A study of how car mileage varies with transmission type
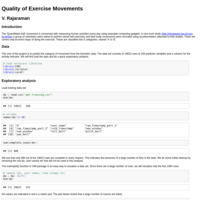
Quality of Exercise Movements
Project report for my Coursera course Practical Machine Learning
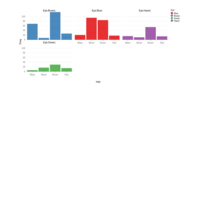
bar1
temp rChart
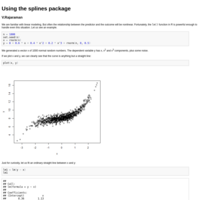
Using the splines package
The lm() function is versatile enough to capture non-linear relationships between variables. This is because the fitted function is still linear in terms of the coefficients !

R Pubs SSL Error
A practical solution to the SSL Error problem preventing you from publishing to RPubs.
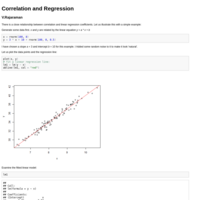
Correlation and Regression
Examine the relationship between linear regression and the correlation coefficient
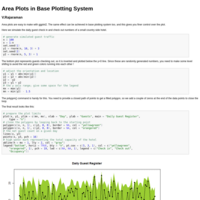
Area Plots in Base Plotting System
Area plots are easy to make with ggplot2. The same effect can be achieved in just 2 lines of code in base plotting system too. This gives you finer control over the plot.
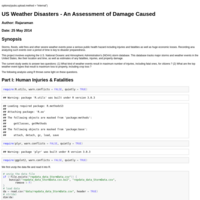
US Weather Disasters - An Assessment of Damage Caused
Assignment 2 for my Reproducible Research course