Recently Published
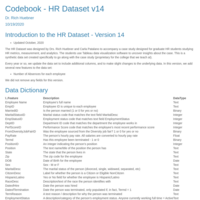
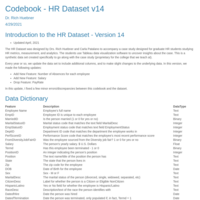
HR Dataset Codebook v14
Updated attribute list.
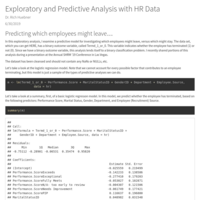
Sample Exploratory Analysis of HR Data
Exploratory analysis of HR Data, and example of predictive analysis.
HR Codebook v13
Codebook for Version 13 of our HR Dataset, to be used to learn data science, machine learning, as it relates to Human Resources
Codebook - HR Dataset v13
This is the codebook for the HR Dataset v13, developed and maintained by Dr. Rich Huebner.
www.linkedin.com/in/RichHuebner
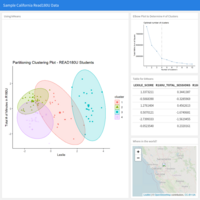
California Exploratory Analysis
Read 180 Universal program data for a California school district was used in this analysis. The analysis demonstrates the relationships between # of sessions students spend in the software and their Lexile score. I use a combination of kMeans clustering for exploratory work and then examine the data using random forest first, and then build a classification tree, also using random forests. Some graphs help visualize the clusters, error rates, and relationships between lexile and # of minutes / # of sessions in software.
Exploratory Analysis of California School District's HMH Read 180 U Data
Read 180 Universal program data for a California school district was used in this analysis. The analysis demonstrates the relationships between # of sessions students spend in the software and their Lexile score. I use a combination of kMeans clustering for exploratory work and then examine the data using random forest first, and then build a classification tree, also using random forests. Some graphs help visualize the clusters, error rates, and relationships between lexile and # of minutes / # of sessions in software.
Analysis of Kavanaugh's Opening Statement
This is a brief text analysis of Brett Kavanaugh's opening statement to the Senate during his SCOTUS nomination hearing testimony.

Data Science Capstone - Presentation
This is a presentation regarding my final project on the Data Science coursera capstone project. This project involved learning about text mining, building corpus, cleansing data, and predicting the next word in a sentence or partial sentence. The prediction algorithm uses the Backoff model, which is relatively straightforward.
Data Science Capstone - Milestone Report
Milestone Report for the Data Science Capstone
kMeans Clustering with HR-related Data
This analysis demonstrates the use of kMeans clustering in R, using HR-related data. The data set is from Kaggle and was designed specifically for analyzing HR data. The kMeans clustering algorithm demonstrates how we place employees into different clusters (or groupings) based on similar characteristics.
DDP - Week 4 Final Project Presentation
This presentation outlines the final project deliverable for the Developing Data Products course through Coursera. Questions can be directed to Dr. Rich Huebner @ Rich.Huebner@yahoo.com
Developing Data Products - Week 3 Assignment - Presentation
A presentation that includes an interesting plot using the plotly package.

Dr. Rich Huebner - Developing Data Products --- Week 3 Assignment
This project asks us to create a plot using the plotly package. I used my own custom data set (with HR data), which is also available at Kaggle.
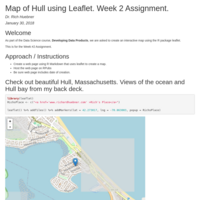
Developing Data Products - Week 2 Assignment
This assignment asks us to create a map (with a popup) using the leafly R package. In this assignment, I decided to use my own house as a location. The popup brings you to my web site.
Practical Machine Learning Final Project
Using devices such as Jawbone Up, Nike FuelBand, and Fitbit it is now possible to collect a large amount of data about personal activity relatively inexpensively. These type of devices are part of the quantified self movement - a group of enthusiasts who take measurements about themselves regularly to improve their health, to find patterns in their behavior, or because they are tech geeks. One thing that people regularly do is quantify how much of a particular activity they do, but they rarely quantify how well they do it. In this project, your goal will be to use data from accelerometers on the belt, forearm, arm, and dumbell of 6 participants. They were asked to perform barbell lifts correctly and incorrectly in 5 different ways. More information is available from the website here: http://groupware.les.inf.puc-rio.br/har (see the section on the Weight Lifting Exercise Dataset).
The analysis looked at using a decision tree and randomForest for predicting the motion that the people did. In this analysis, the randomForest approach performed better in its predictive accuracy (99.8%).
Motor Trend Automobile Analysis
This analysis investigates a data set from Motor Trend, a magazine about the automobile industry. Looking at a data set of a collection of cars, Motor Trend (MT) we are interested in exploring the relationship between a set of variables and miles per gallon (MPG) (outcome). MT is particularly interested in the following two questions:
Is an automatic or manual transmission better for MPG
Quantify the MPG difference between automatic and manual transmissions
The approached used throughout this analysis is based on general linear models. More specifically, multiple linear regression will be used to determine the extent to which independent variables contribute to MPG. I will also determine if there is a statistically significant difference between automatic and manual transmissions with respect to MPG.
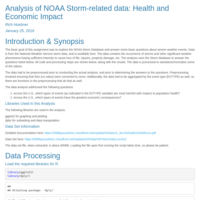
Project 2 for Reproducible Research course
This is project #2 for the Coursera course on Reproducible Research. It contains an analysis of the NOAA National Weather Service storm data.
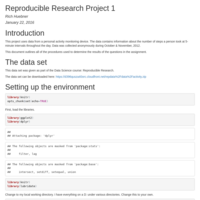
Reproducible Research Project #1
This is the final deliverable for the Reproducible Research Project #1 for the Coursera course. The data set is fitbit or activity tracker data for October through November, 2012.
