saharava
sahar
Recently Published
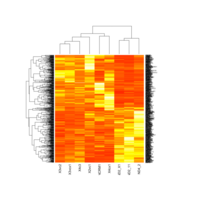
Differential expression between control and NRXN1α deletion of iPSC derived neurons.
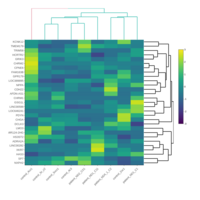
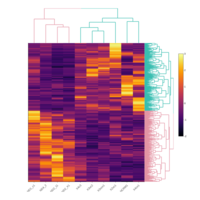
Bivariate clustering of samples (Columns) of the 530 differentially expressed genes at FDR 0.05 or less (rows). The colour ranges from purple (upregulated genes) to yellow (downregulated genes) based on TPM values.
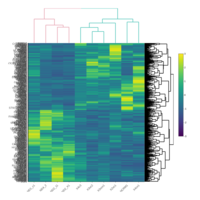
Bivariate clustering of samples
Differential gene expression between NRXN1α and control