
sanjmeh
Sanjay Mehrotra
Recently Published


IdleON
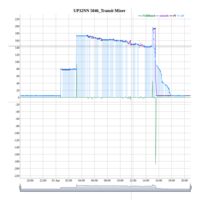
Midwest
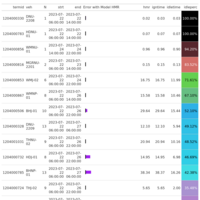
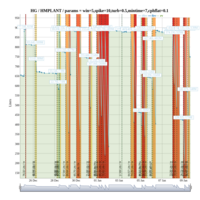
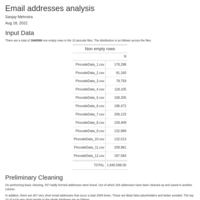
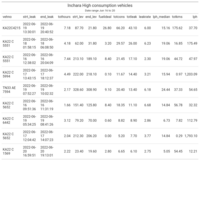
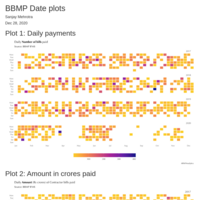
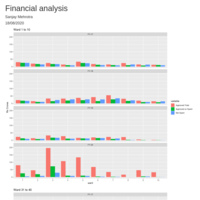
Mindshift fuel management system reports
Version 1.1, with descriptions updated till report 7.
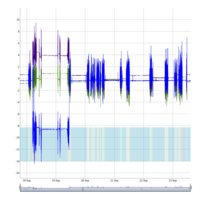
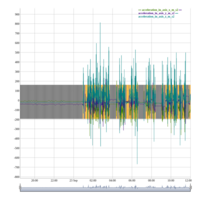
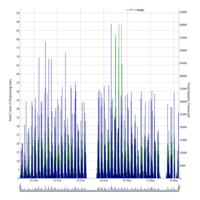
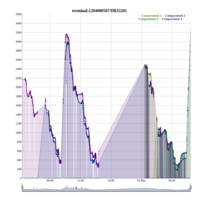
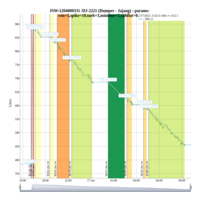
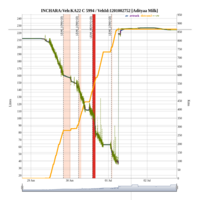
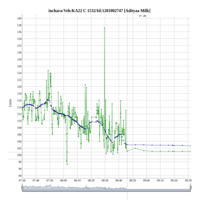
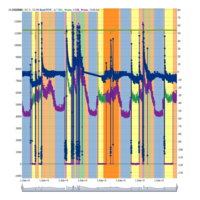
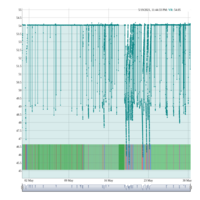
vibrations vs speed
This dumper's x,y,z vibrations can be seen along with corresponding speed in color codes
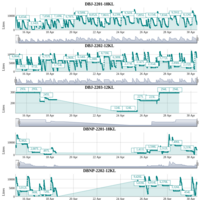
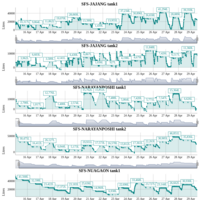
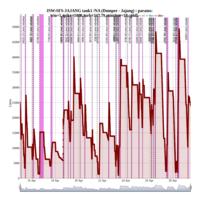
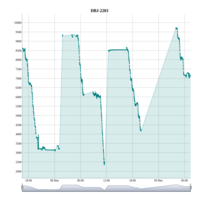
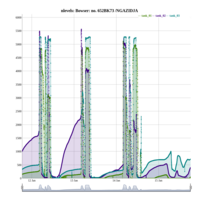
Jajang Tank 01
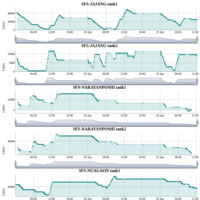
SFS tank 01
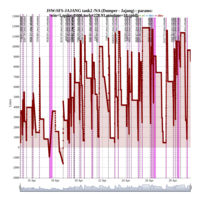
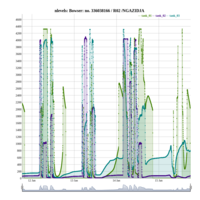
SFS Jajang Tank 2q
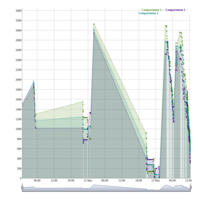
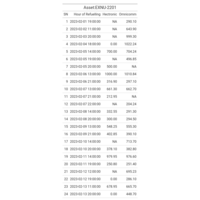
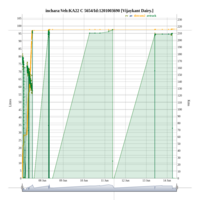
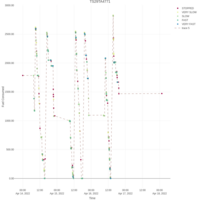
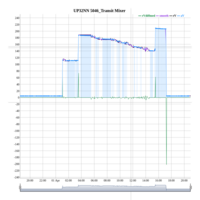
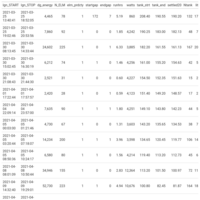
Refuellings
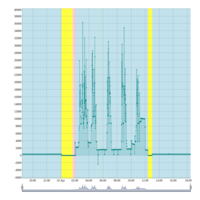
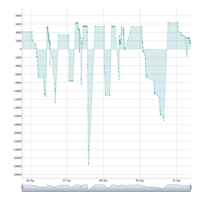
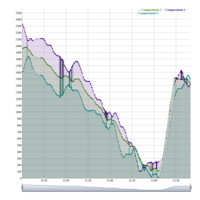
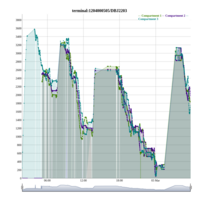
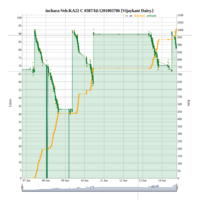
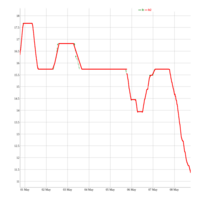
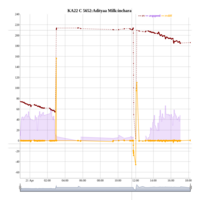
Flaring out
See the flare out of the 3 compartments at the end. Why?
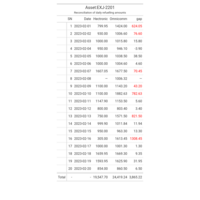
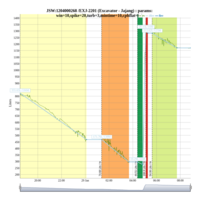
EXJ2201
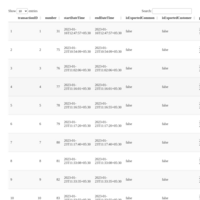
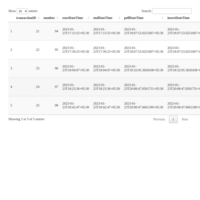
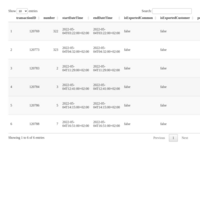
Reco betw Omni and Hectronic
Reco Feb 1 to 20 for first asset
Reconciliation of refuellings
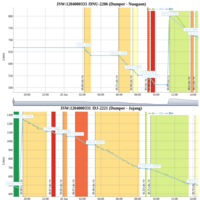
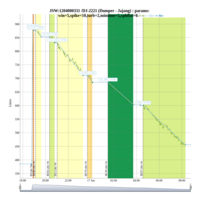
Dumper 2221
Jajang
Jajang dumper
First fuel modelling of Jajang Dumper
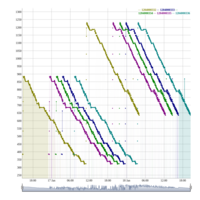
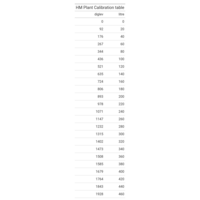
HM Plant model 1
Two weeks data model
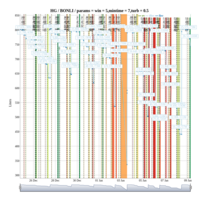
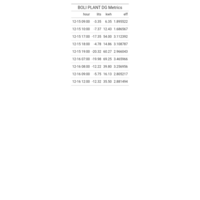
boli dg metric
Updated till 1:40 pm
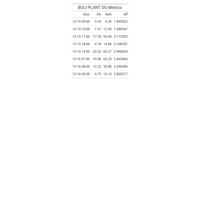
Boli DG metric
SHows hourly data where > 0 litres consumed
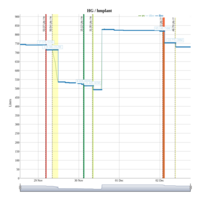
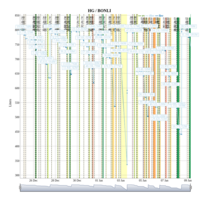
HG.Dec2
First fuel level upload for verification
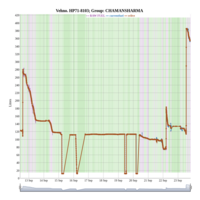
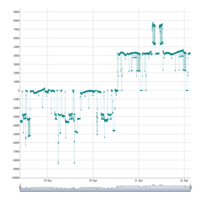
painful dips
Fuel level dipping for several minutes not reaching zero
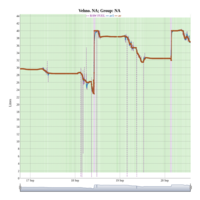
small_refills
two small refills
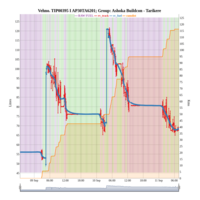
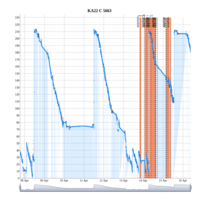
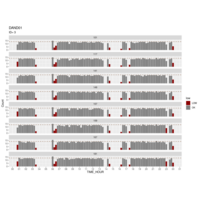
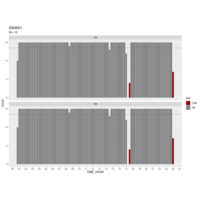
EER on TSD
Now we can see the section of fuel graph with low EER (high CPH).
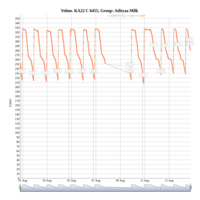
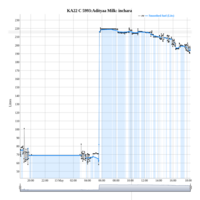
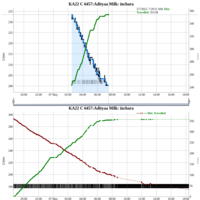
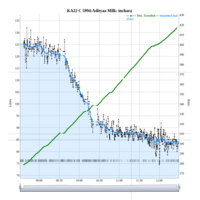
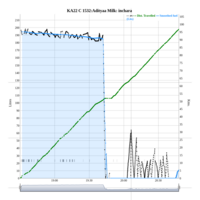
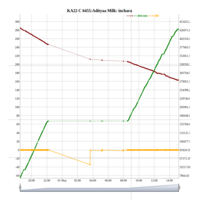
Vehno. KA22 C 6455;
Drain detection POC
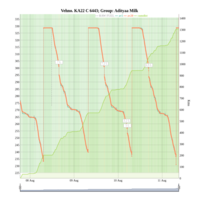
leak
leakage in moving asset
1201003706
6 to 8 am
Peculiar spikes
This one has peculiar spikes in raw levels.
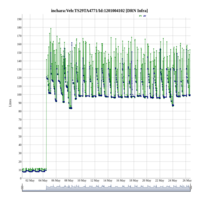
noisy_data
A noisy sensor example
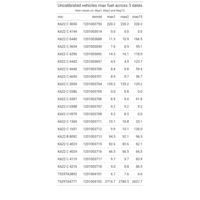
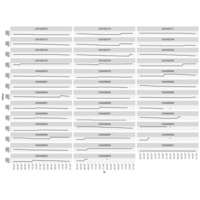
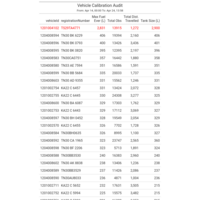
Uncalibrated testing
Balance 42 assets were tested today for 3 dates.
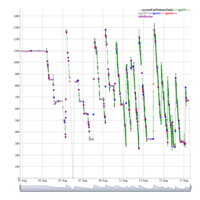
tsoutlier works on reduced window
The blue dots are after applying tsclean() ... green lines are original data so here tsoutliers has worked perfectly to detect the outlier points at 02:14
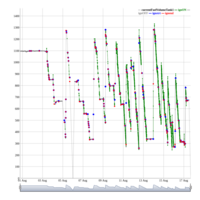
tsoutlier fails
The blue and green lines are coinciding which means tsoutliers has failed to detect the outlier points at 02:14
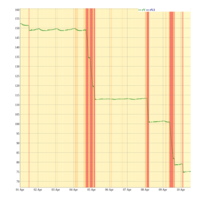
Jobner drain on May 10
Zoom into the May 10th date to see the clear drain
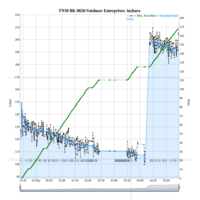
dip before the refill
Just before the filling starts there is huge fall in level
case4
7 am to 8 am consumption is very high
case3
Is this fake refuel?
case2
From 1500 to 1600 the consumption increased 5 times normal
case1
Sensor seems dies at 1 AM.
facet1
all vehicles bird's eye view
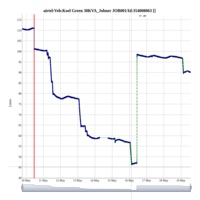
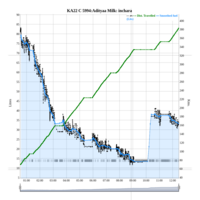
drain inchara 6455
The detected drain by omnicomm is 22 lits while actually this looks to be 42 lits drain.
calibration_drain
is this a drain test?
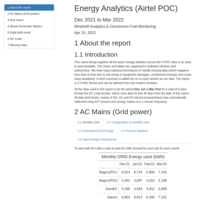
Dec to March 2022
POC base reports
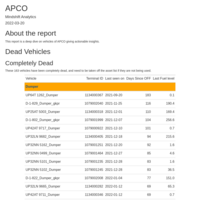
APCO reports
These are analytics on APCO vehicles
base_report
base reports produced from the POC
FuelTSD
Fuel tsd facet ncol =1
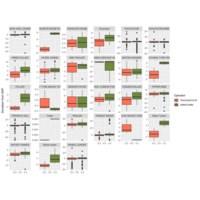
Operator wise performance
Two key operator performance on same assets
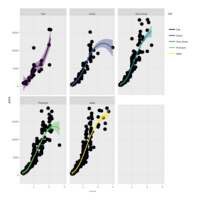
classification of time series using kmeans
EB Watts, DG Watts, DCV and Ibatt are the 4 dimensions on which we use a kmeans with k = 5.
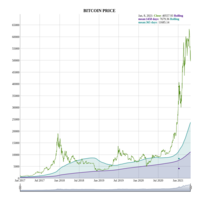
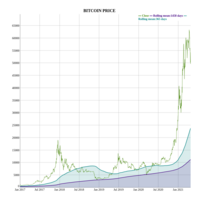
Bitcoin Price with Moving Averages
Over two window sizes: 365 days and 1458 days
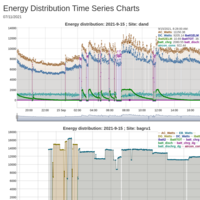
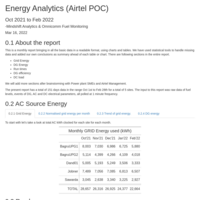
Energy Distribution
To get a feel of variations in the distributions of energy across the POC sites. ALso across dates for the same site.
Battery_charge
Classification of Time Series Data of battery voltage into three classes using Decision Tree Learning.
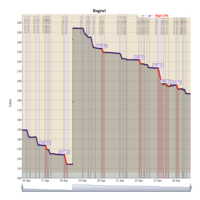
Bagru2_analysis
Bagru2 has many ELM errors.
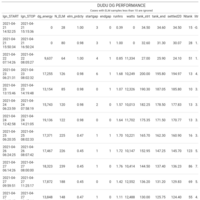
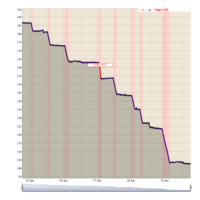
Dudu_analysis
Dud DG performance
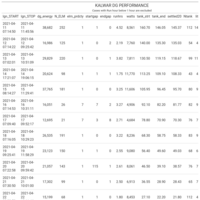
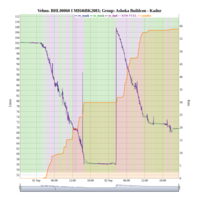
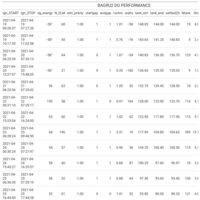
Kalwar_analysis
Kalwara DG performance analysis
Dand_analysis
Dand Analysis of LPU
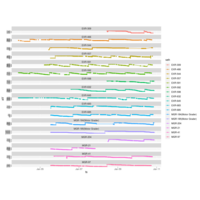
ribbon_dygraph
WIth both battery and DG on shaded
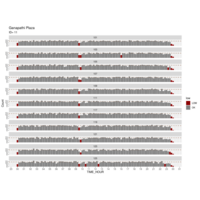
reliability_DC_EM_Ganapthi
Reliability measured as count of observations received every 15 minutes across all parameters from Ganapathi plaza from ELM4100 DC EM
reliability_AC EM
Observation counts of ELM8420 in DAND for the entire day of 22nd, captured every 15 minutes.
reliability_RUT_Dand
These are number of observations received every 15 minutes for each parameter seen separately.
The data shows RUT955 counts for the entire day of March 22 (midnight to midnight).
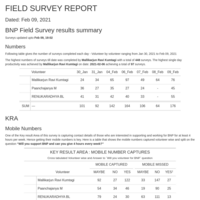
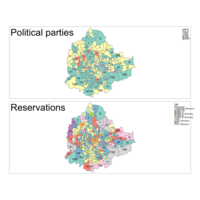
Field Survey results
BNP field survey results summarised
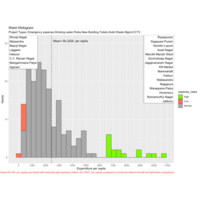
Histogram for per capita heads
Except Roads, Drains and Footpaths all other expense heads included in the per capita expense histogram.
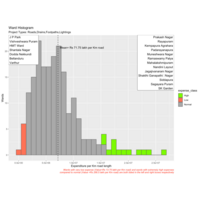
Histogram with two side tails highlighted
Boxed wards on both sides.
X-axis is Per km spent on Roads, Drains, Footpath and Lighting.
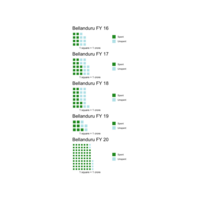
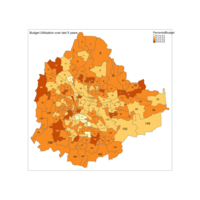
Budget utlisation waffle charts
Sample waffle charts for Bellanduru budget utlization. Also shows relative size of budget across each year
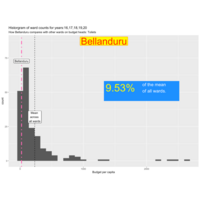
Toilet Budget per capita for social media
Designing this for social media
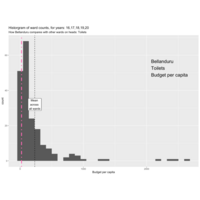
Histogram Toilets
Histogram across all wards on Toilet Budgets
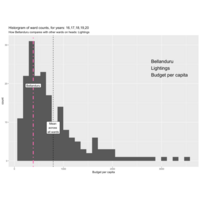
Histogram on Lightings - Highlight Bellanduru
Histogram of wards showing Budget per capita on Lightings - highlighting bellandur

Bellanduru_Parks
Hisotgram across all wards Budget per capita on head: parks
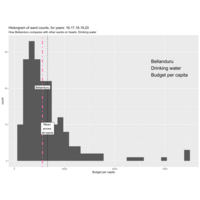
Bellanduru - Drinking Water
Drinking water per capita histogram across ward
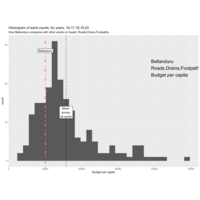
Bellanduru - Roads
Histogram of Roads, Drains and Foothpaths - Budget per capita
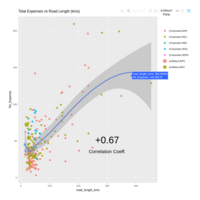
Expense vs Road Length (Correlation)
Scatter plot for all 198 wards, total expense vs total road length.
In addition color of point denotes: Political Party.
Size: ex Mayor (large size)
In addition we see the fitted curve & correlation coeff.
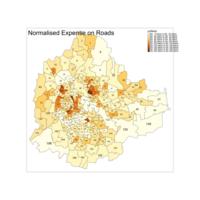
Normalised Road expenses in last 5 years
Normalised expenses means Expenses per km or road existing in the ward.
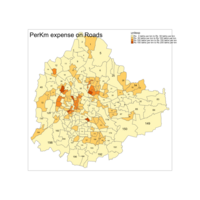
Road Expenses (per kms of roads int he ward)
Unit expenses (Expenses per kms) on roads
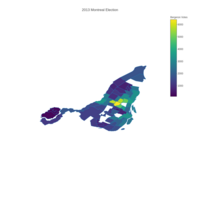
Montreal Elections
test
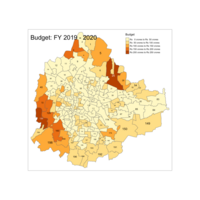
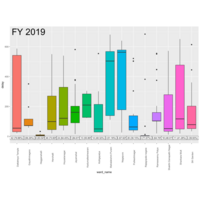
Ward Budgets 2019-20
BBMP Budget for FY 2019-20, ward wise
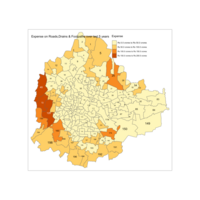
Expenses on Roads, Drains and Footpaths
Expenses over 2015 to 2020
Budget utilisation
Utlisation of BBMP Budget from 2015-16 to 2019-20
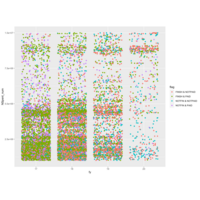
Dot plot of projects 10L to 1 Cr in value
Projects between the value of 10L to 1 Crores and who have data stamp availability for FINISHED DATE and PAID DATE in all 4 combinations.
The points are shown in jitter mode to expose the density of the projects every year.
ward 100 to 120
Expense to Approved amounts
SPENT vs APPD
Sample of 10 wards plotted on Net Spent year on year vs approved amounts on the same job numbers that were undertaken.
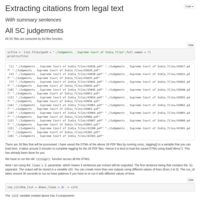
citations
We are using this to test our citation function
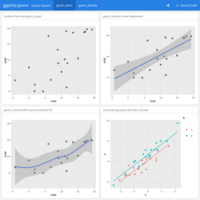
Plot - test
for checking attendance overlaps
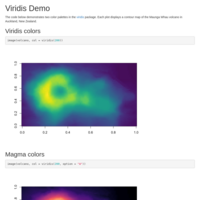
Magma colours
Testing the publishing
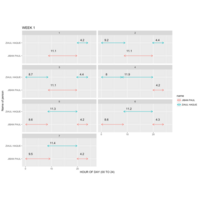
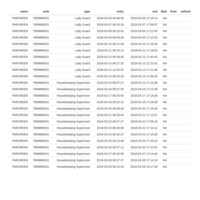
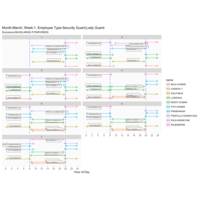
Shift duty visualisation
Shift duty rosters can be published using spreadsheets but then the actual IN and OUT of an employee is the difficult thing to track - even if they are electronically checked in and out. The data is immense and difficult to visualise in relation to each other. These duty hours line charts are simple to understand and give immediate insights.
hack_macau
Seems a hack attempt from Macau

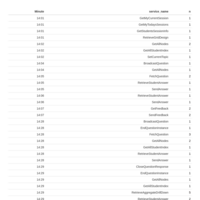
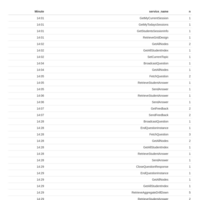
mysql-select
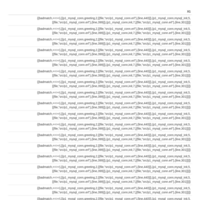
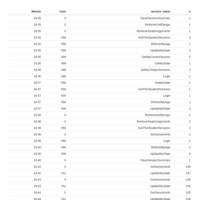
these mysql logs include all SELECT statements of jupiter along with APIs that start around 22:44
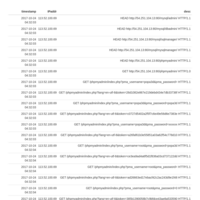
sql_logs_ejabberd
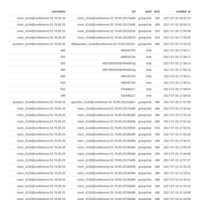
these logs are combined logs for 10 minutes of API firing as well as MySQL: including ejabberd and jupiter_dev
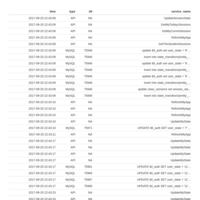
combined_log with xmpp
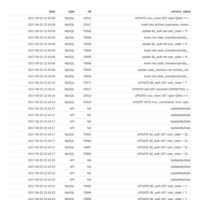
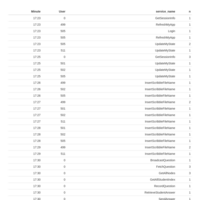
These logs have all UPDATE, INSERT including XMPP MySQL,. Note: We are truncating the scripts at 40 char.

combined_log
API log merged with MySQL log
xmpp error log
filtered on mysql
queries
last 100 queries
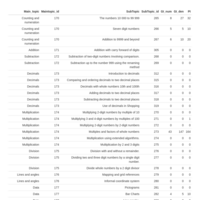
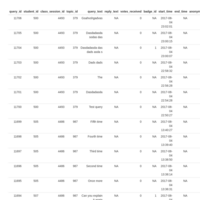
Topics-class22
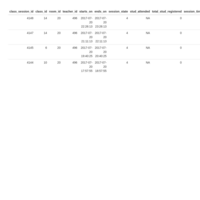
Listing of topics and subtopics in class id 22
R api logs
R API flooding
xmpp_logs1
These are sample logs captured
APi flood
with color text
ApiFlood
TIme plot of API counts
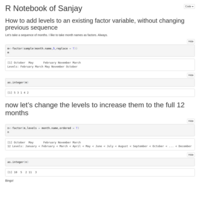
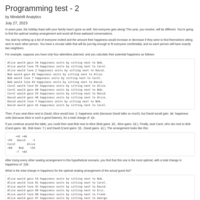
How to add more levels to a factor without changing the original levels
This doc explains when you are capturing data and you know you are going to grow a variable into many levels, how do you maintain the old factors.
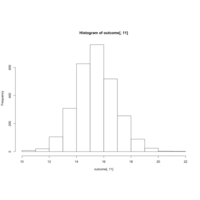
Plot-1
just a simple histogram