
sdutky
Steve Dutky
Recently Published
mcData205spring2022asgEDA
Class assignment to look over dataset from DataMontgomery. This looks at Drainage-Erosion-Repair
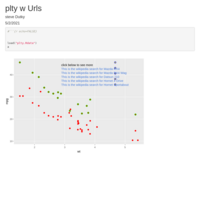
Test of ggplotly with embedded urls
quick test
Progress Report: Housing Code Enforcement Project Plan
for mc DATA 205 Spring 2020
project plan: MC Housing Code Enforcement
means, motive, opportunity
Census Block Groups: wrangling Geospatial Data
mcData205 work
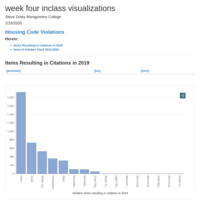
mcData205WeekFourInClassVisualizations
from MoCo Housing Code Violations
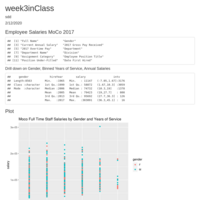
MocoFullTimeSalarySeniorityGender
week 3 in Class
mc205datasetFeedback
3 datasets for week2:
Household Income and Incarceration for Children from Low-Income Households by County, Race, and Gender
Baseline Cross-Sectional Estimates by College
Neighborhood Characteristics by County
dataMontgomeryCatalog
Datasets available for Montgomery County Maryland as of Jan 29, 2020
regexTutorial
Regular Expression Tutorial with Focus on R
alluvialPacExpenditures
alluvial diagrams of PAC expenditures reported to the U.S Federal Elections Commision election cycles 2010-2020
NB: using log scales on an alluvial plot is clearly deficient. Although the width of each alluvium is correctly represented, the divisions on the strata are clearly misleading: sum($) != sum(log($)). Could a box representing log(sum($)) be superimposed on each sum(log($)) division?
sdutkyMcData110Asg10
fattyAcidsInItalianOliveOil
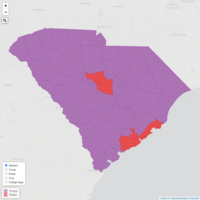
southCarolinaGop2016PresidentialPrimary
[Computerworld's How to Make a Map with R in 10 (fairly) Easy Steps]( https://www.computerworld.com/article/3038270/data-analytics/create-maps-in-r-in-10-fairly-easy-steps.html)
Webscraping,ggplot and plotly
scraping, cleaning, and plotting the results of an IMDB search
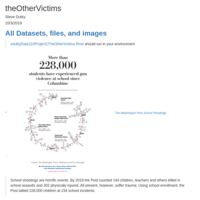
theOtherVictims
analysis of schools near homicides
Using Wordclouds to Depict Hate Crimes in NY 2010-2016
MC DATA100 assignment 5

mcData110Assignment3Update
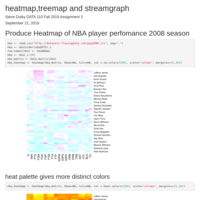
Examples of heatmap, treemap, and streamgraph
mcData110Assignment3
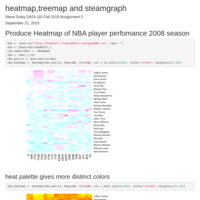
Examples of heatmap, treemap, and streamgraph
mcData110Assignment3
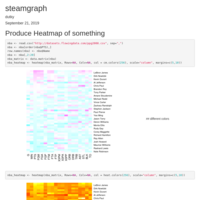
Sample of heatmap, treemap, and streamgraph
sdutkyMontgomeryCollegeData110Asg2Part3
intro to ggplot & tidyverse